

Room Area Viewer Editor
PROJECT AT A GLANCE

Led end-to-end UX/UI design and collaborated with a team of five to deliver a Revit data analysis plugin that streamlined spatial classification, centralized data management, and improved workflow efficiency, adopted by 400+ users across six studios.
Role:
Sole Product Designer
Figma, Miro, & XD
Timeline:
20+ Weeks – 2023 Beta Testing, 2024 MVP Launch
Client:
SmithGroup, A&E Firm
Product Solution


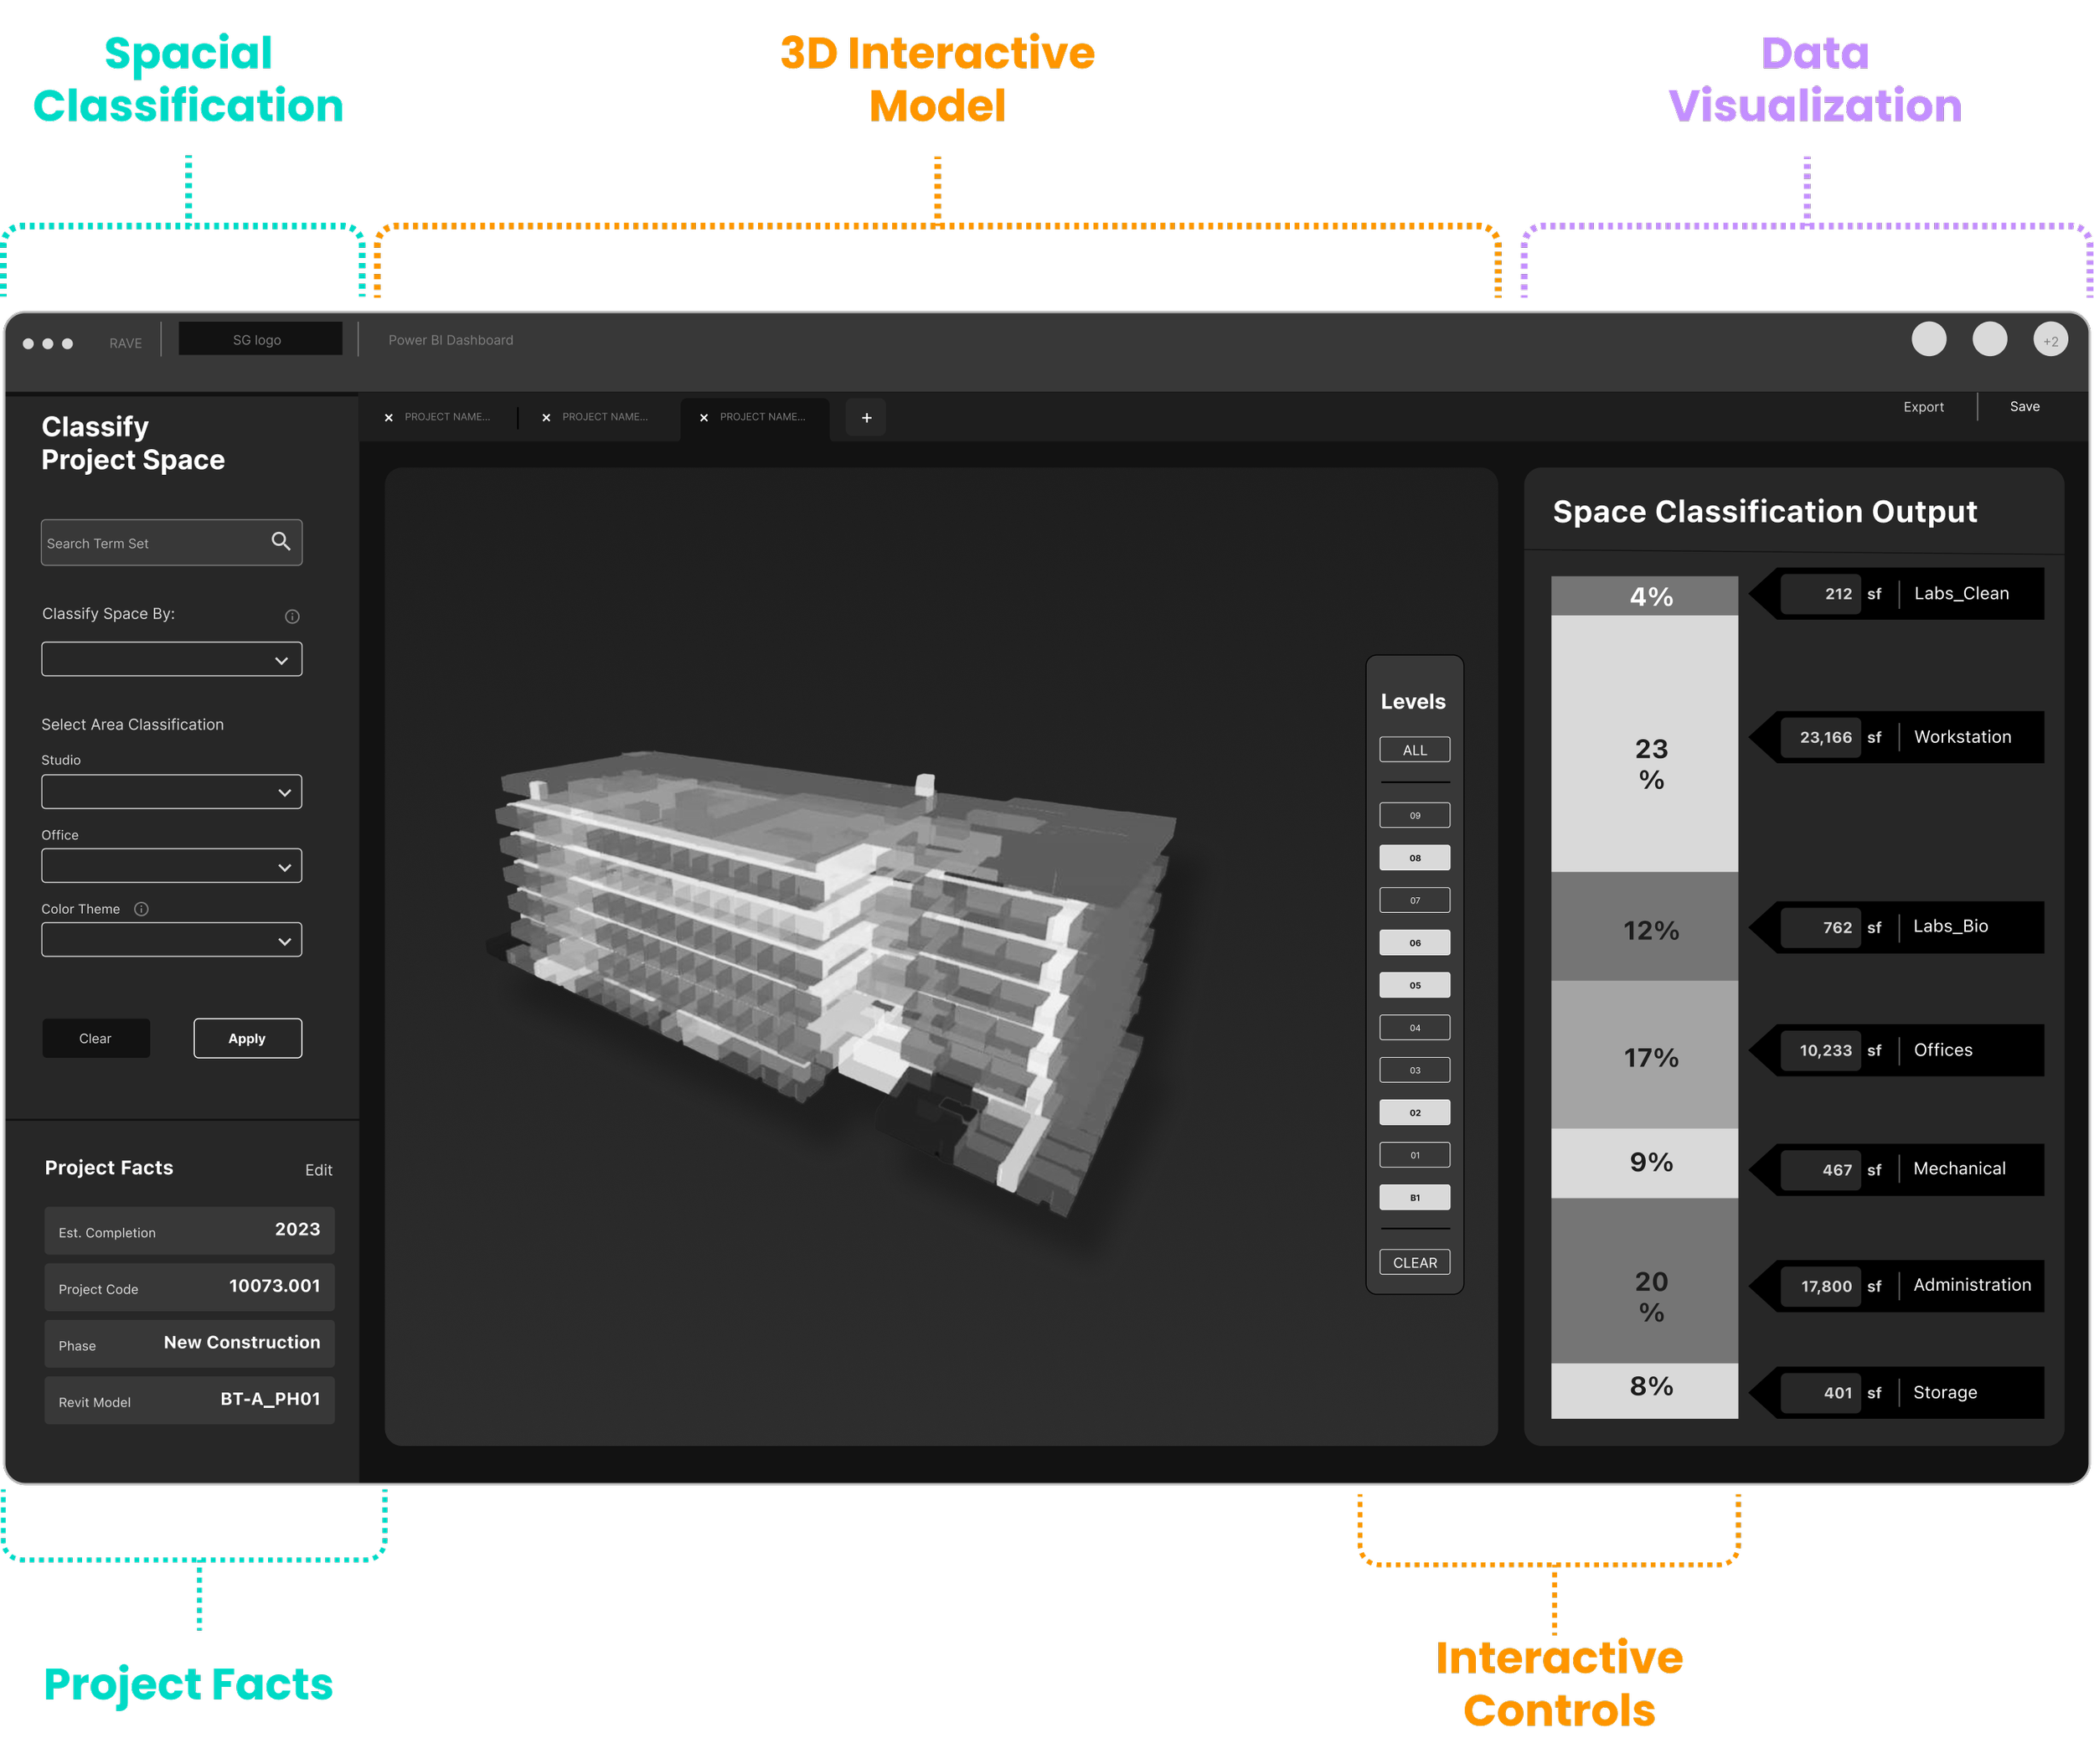
1.0 Final Prototype (Figma)
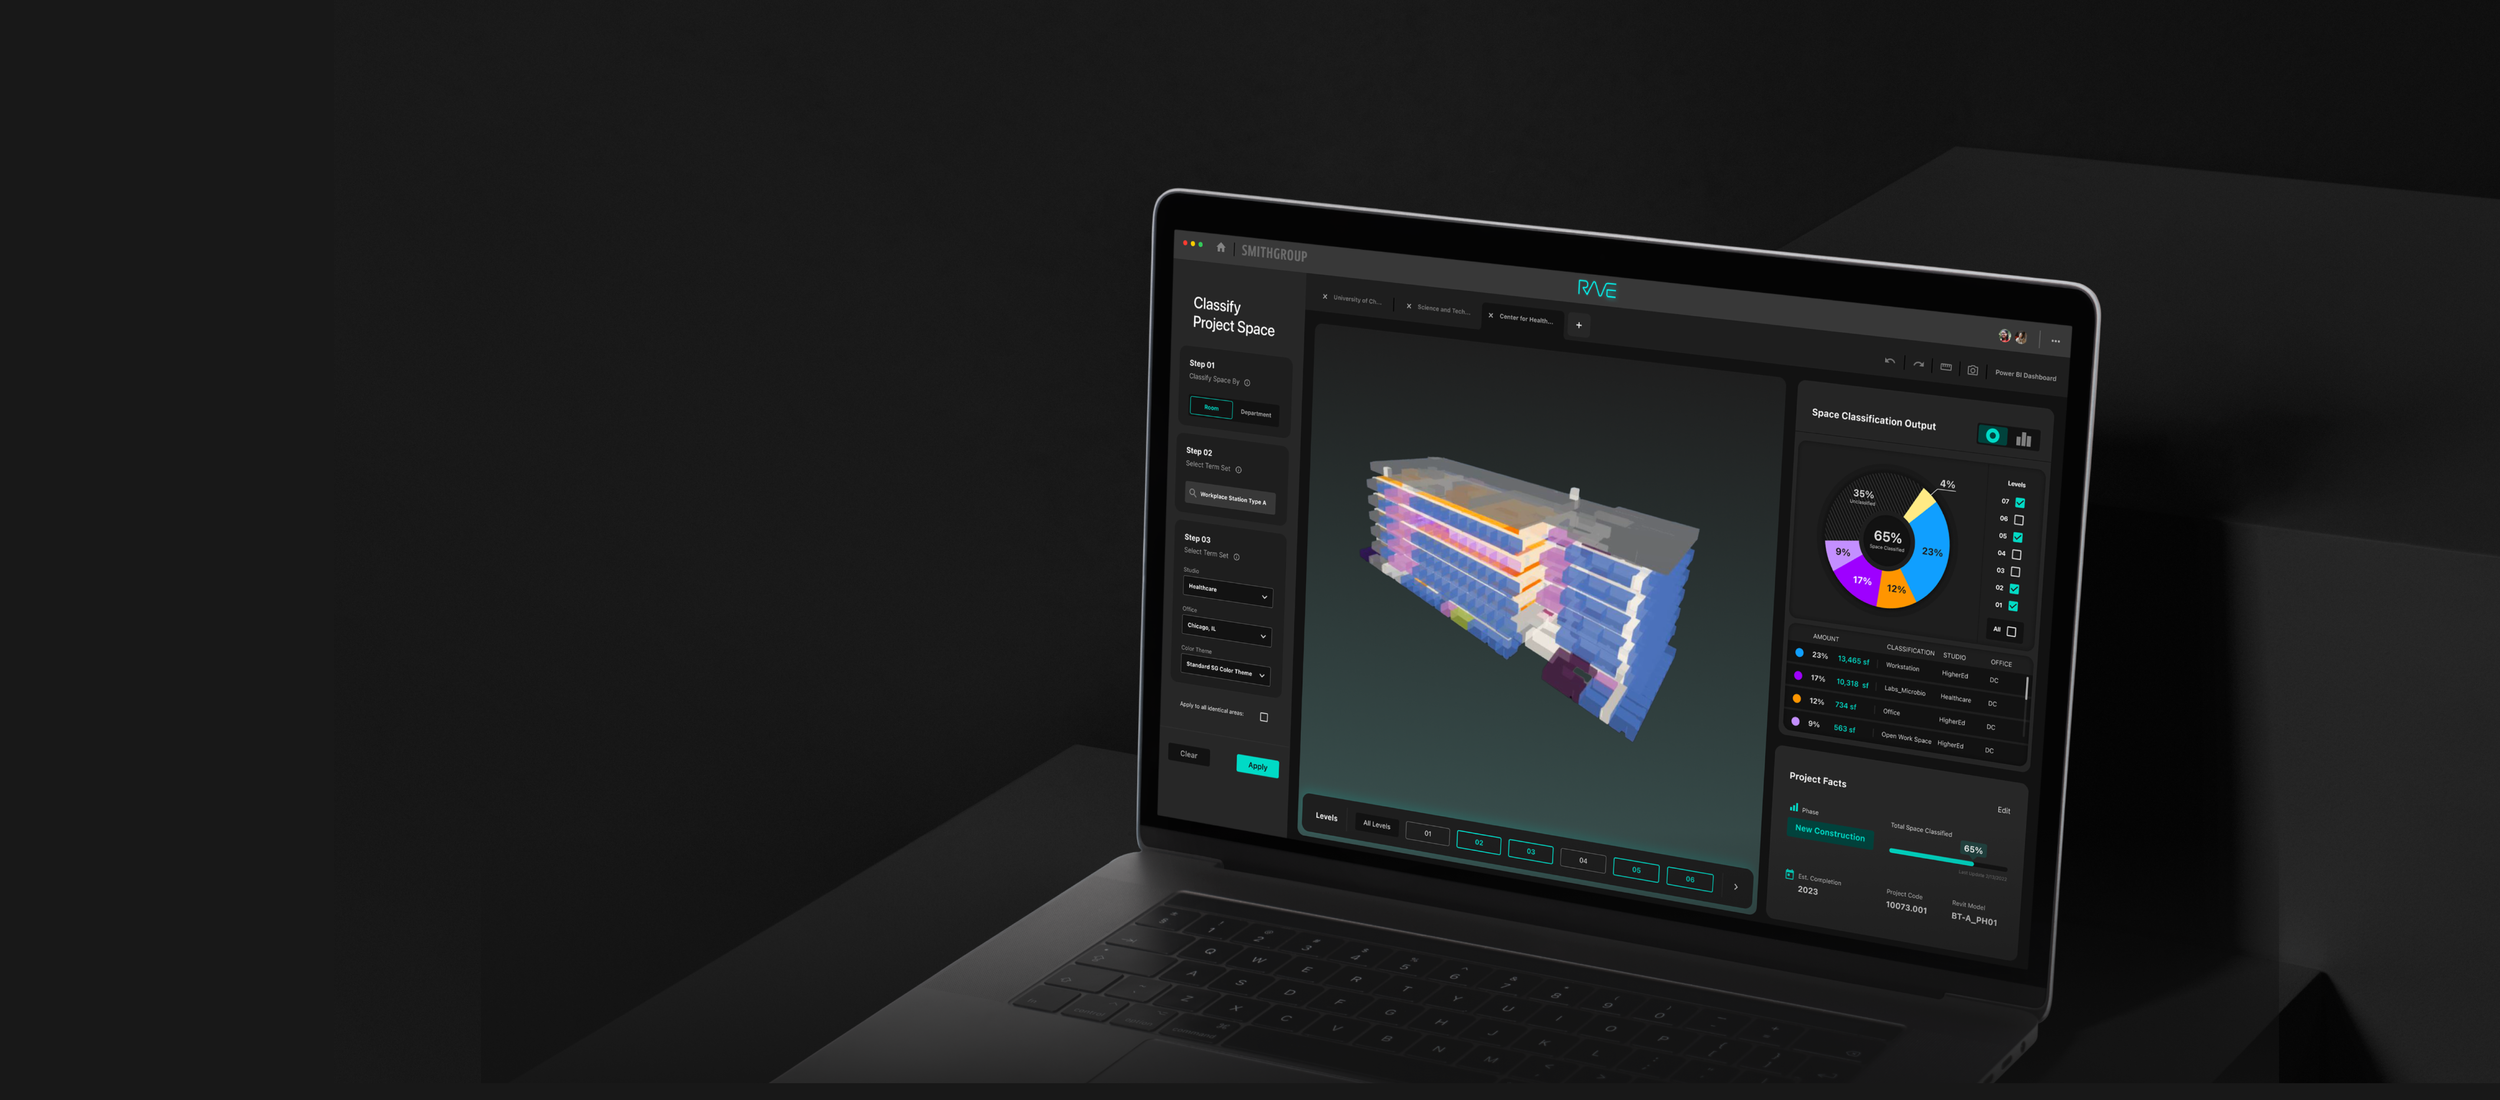
What is R.A.V.E?
R.A.V.E. is a data analysis plugin for Autodesk Revit designed to simplify spacial classification process & centralize data management.

What does that mean for users?

Before – Complex data entry workflow.

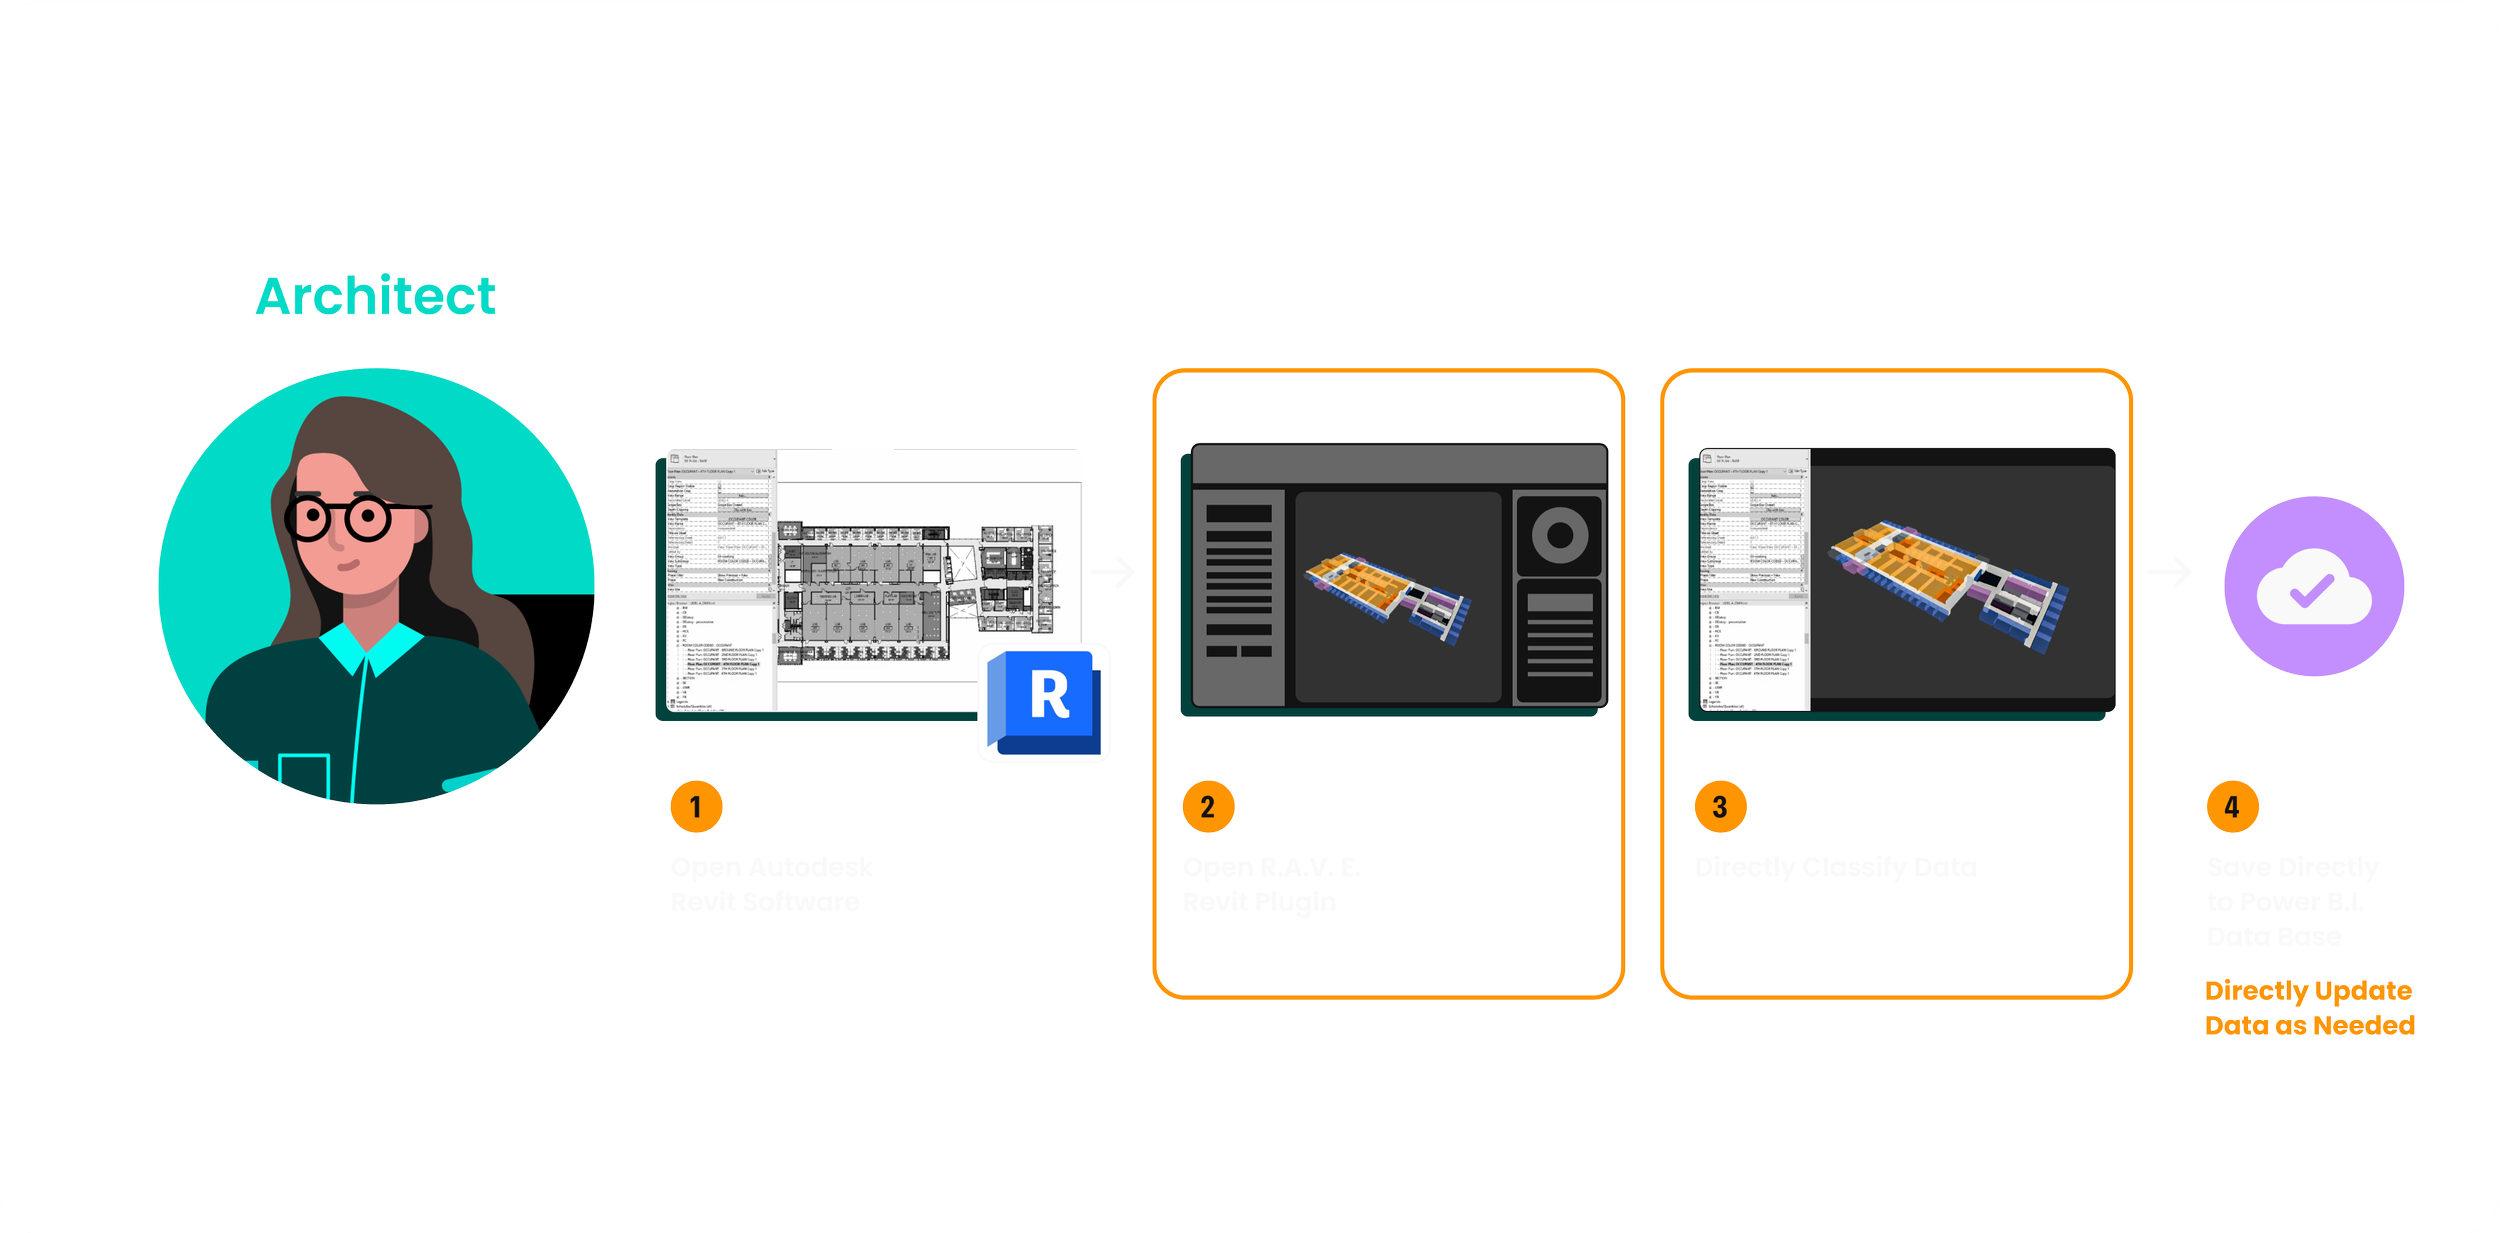
After – Streamlined data entry process with R.A.V.E. plugin.
1.0 Streamlined Workflow Implementing RAVE

2. Project Roadmap

Problem
Architects struggle to classify spatial usage datasets efficiently, leading to inconsistent data practices, slower project analysis, and limited insights across studios.

Goal
Optimize how architects classify and access spatial data to reduce manual effort, increase efficiency, and support data-driven design decisions.

Success (KPI)
– Reduced manual spatial classification and data retrieval time by at least 25%.
– Achieved adoption of R.A.V.E. in at least 3 in-house studios.
– Engaged 100+ active users firmwide.
Digging Deeper
Understanding the Why Starts with Listening


Employee surveys surface the real-world roadblocks users face.
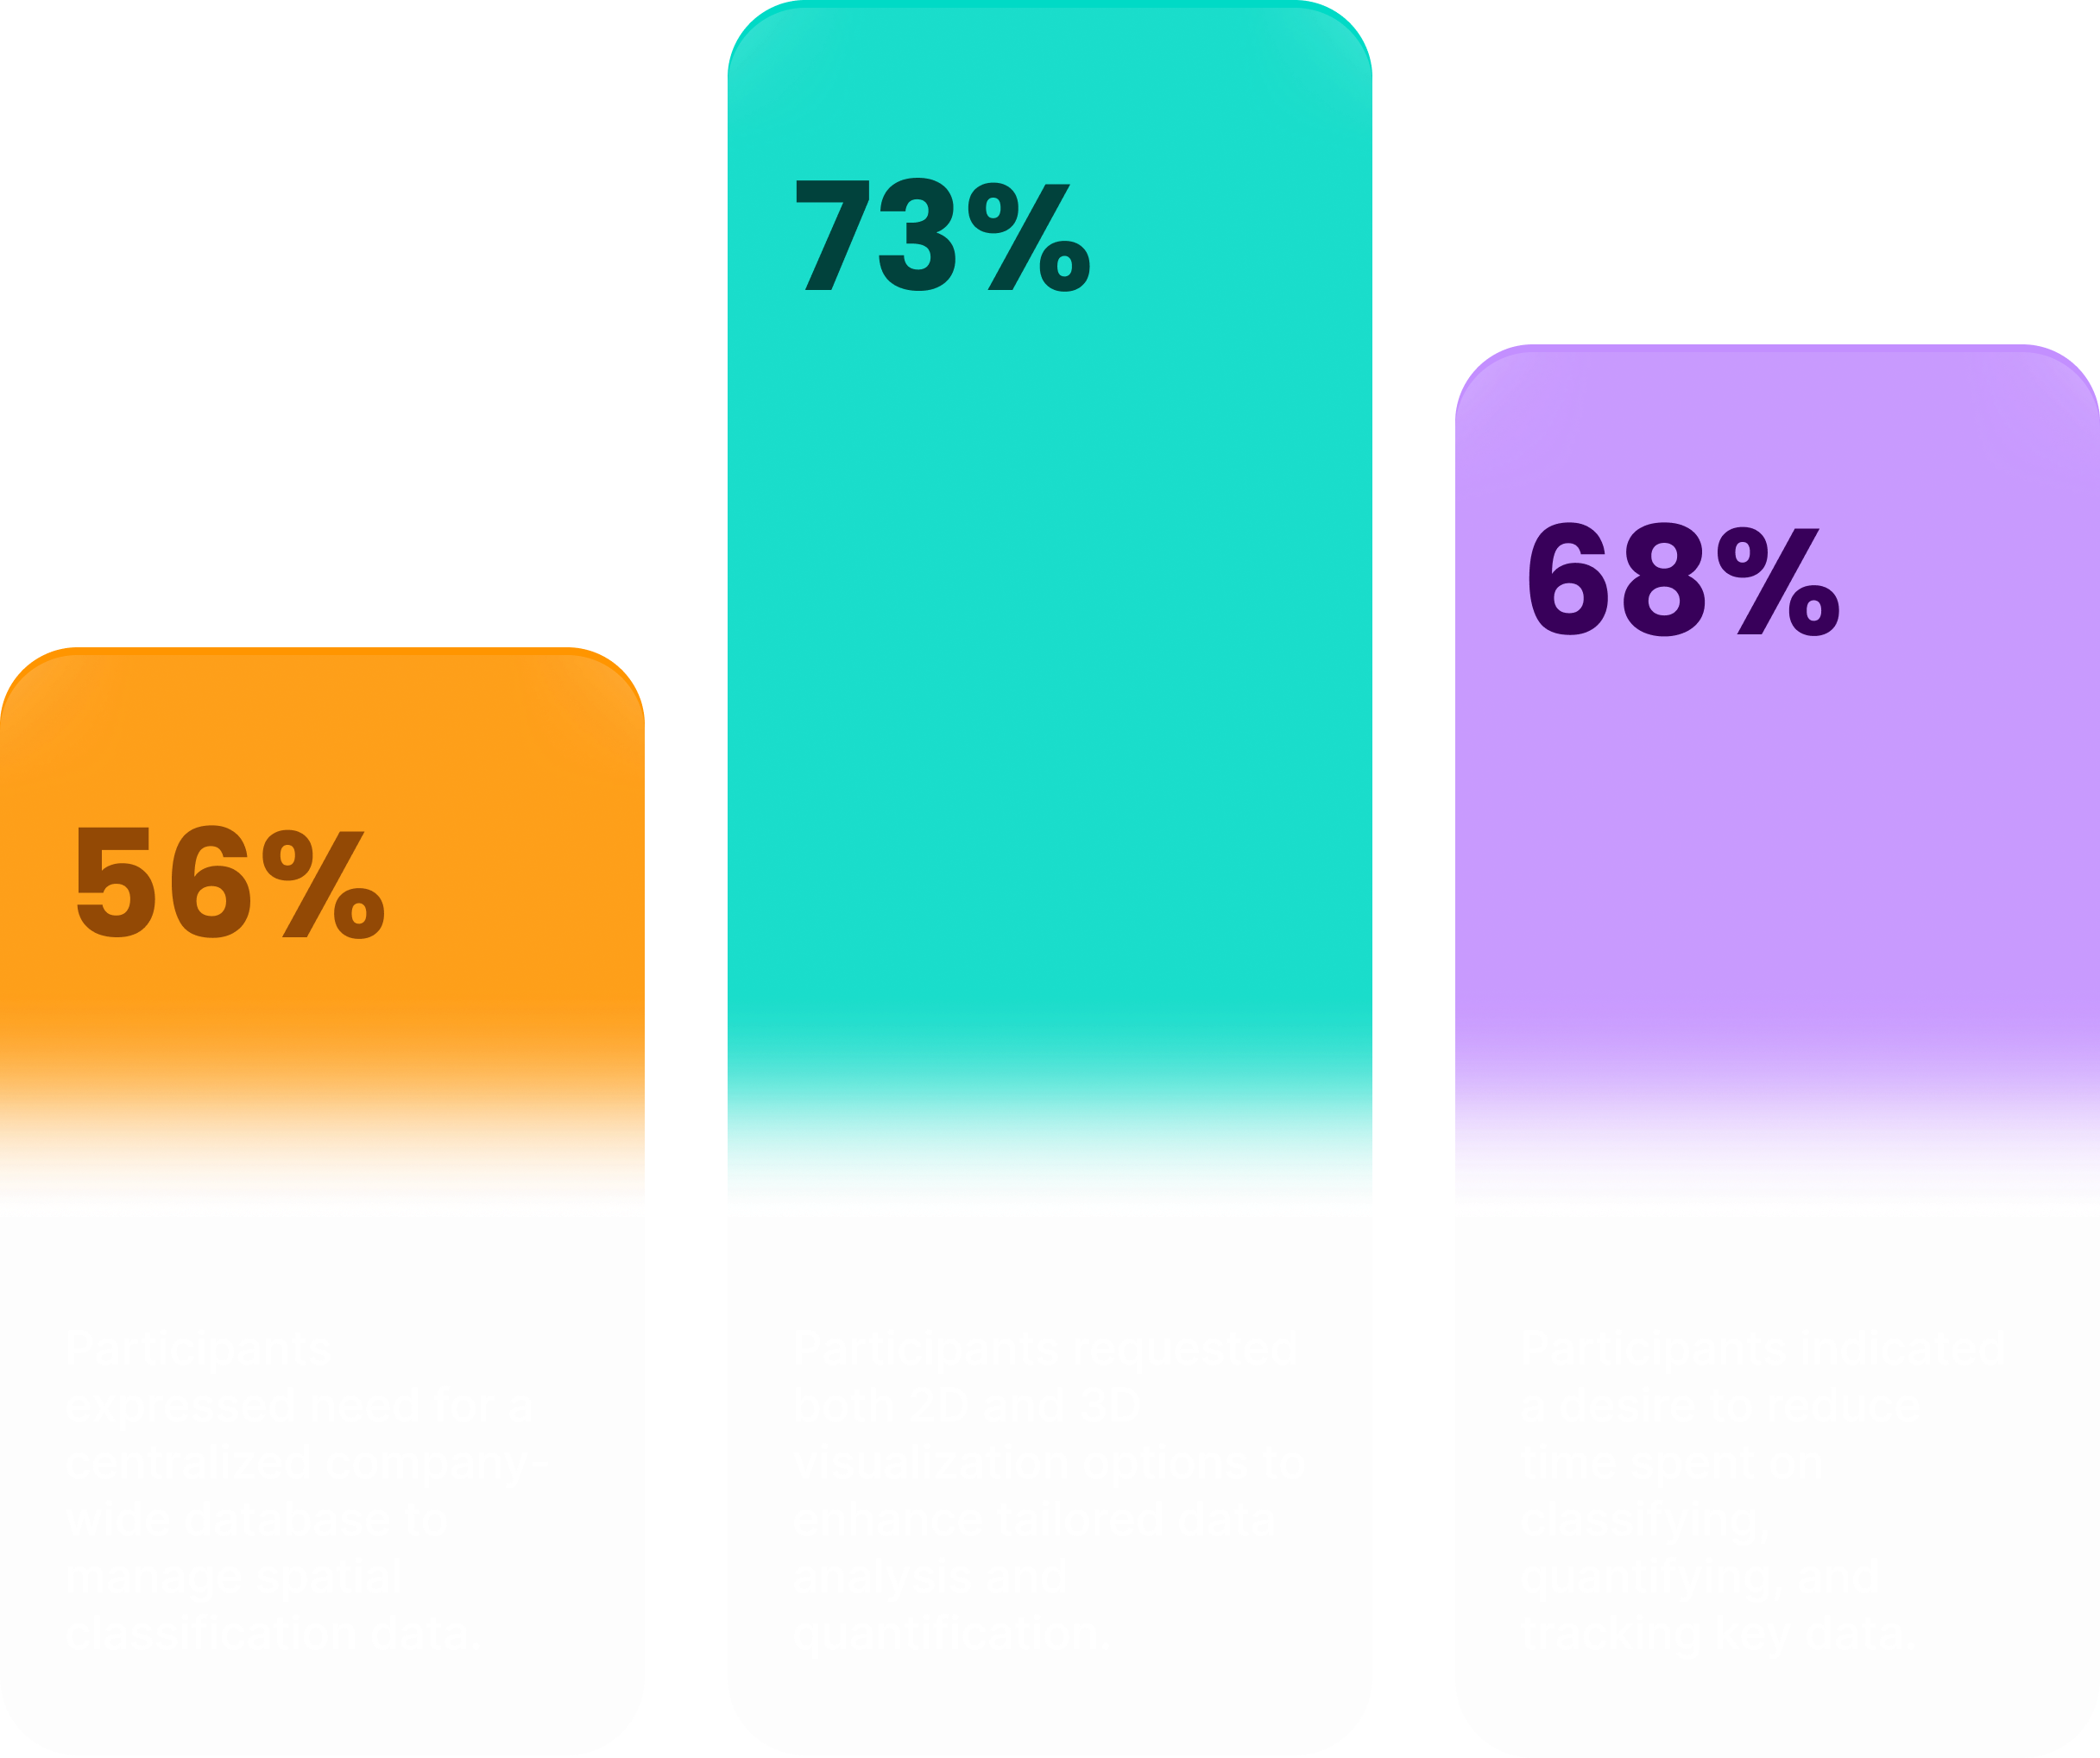
Insight-Driven Opportunities
Key themes revealed through survey feedback, highlighting where to focus UX improvements.

Uncovering workflow friction and hidden drop-offs through personas and user journeys. (Figure 3.0)
Bringing Insights to Life


3.0 Personas & User Journeys
Information Architecture
Mapping New Worflows
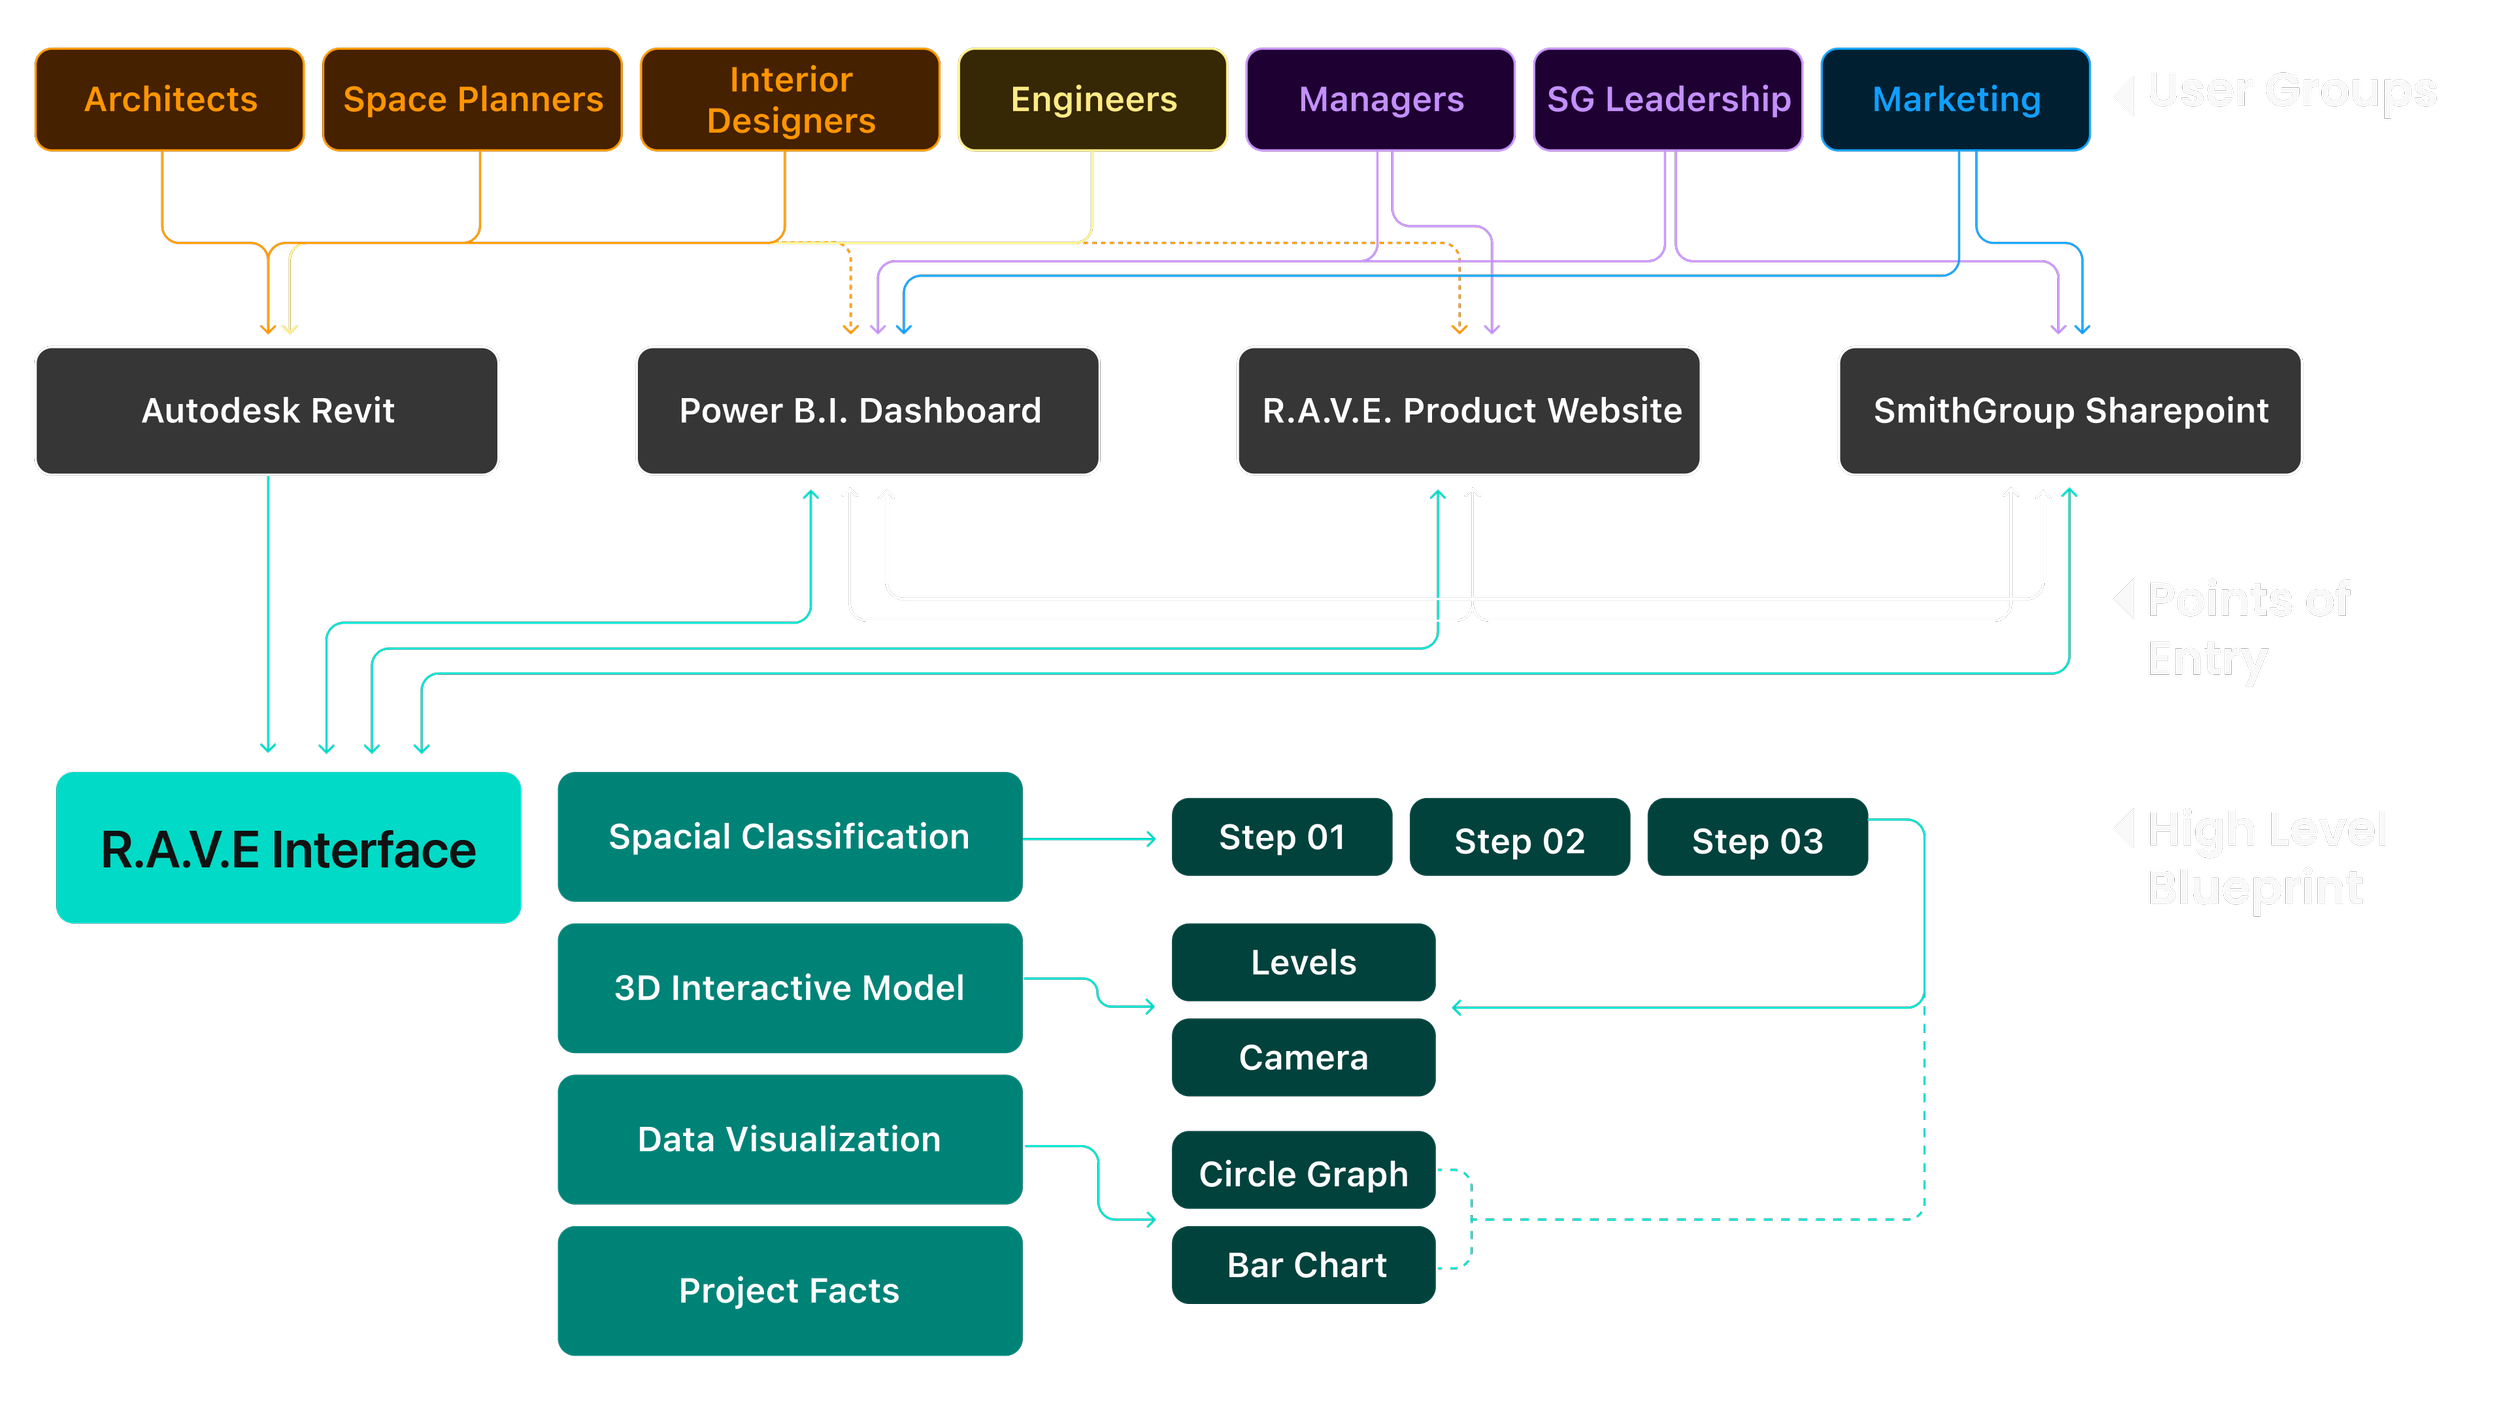

3.1 IA Structure Mapping Key User Workflows
Technical
Constraints
Developers explored the framework early, establishing technical constraints that guided my design exploration.

50+
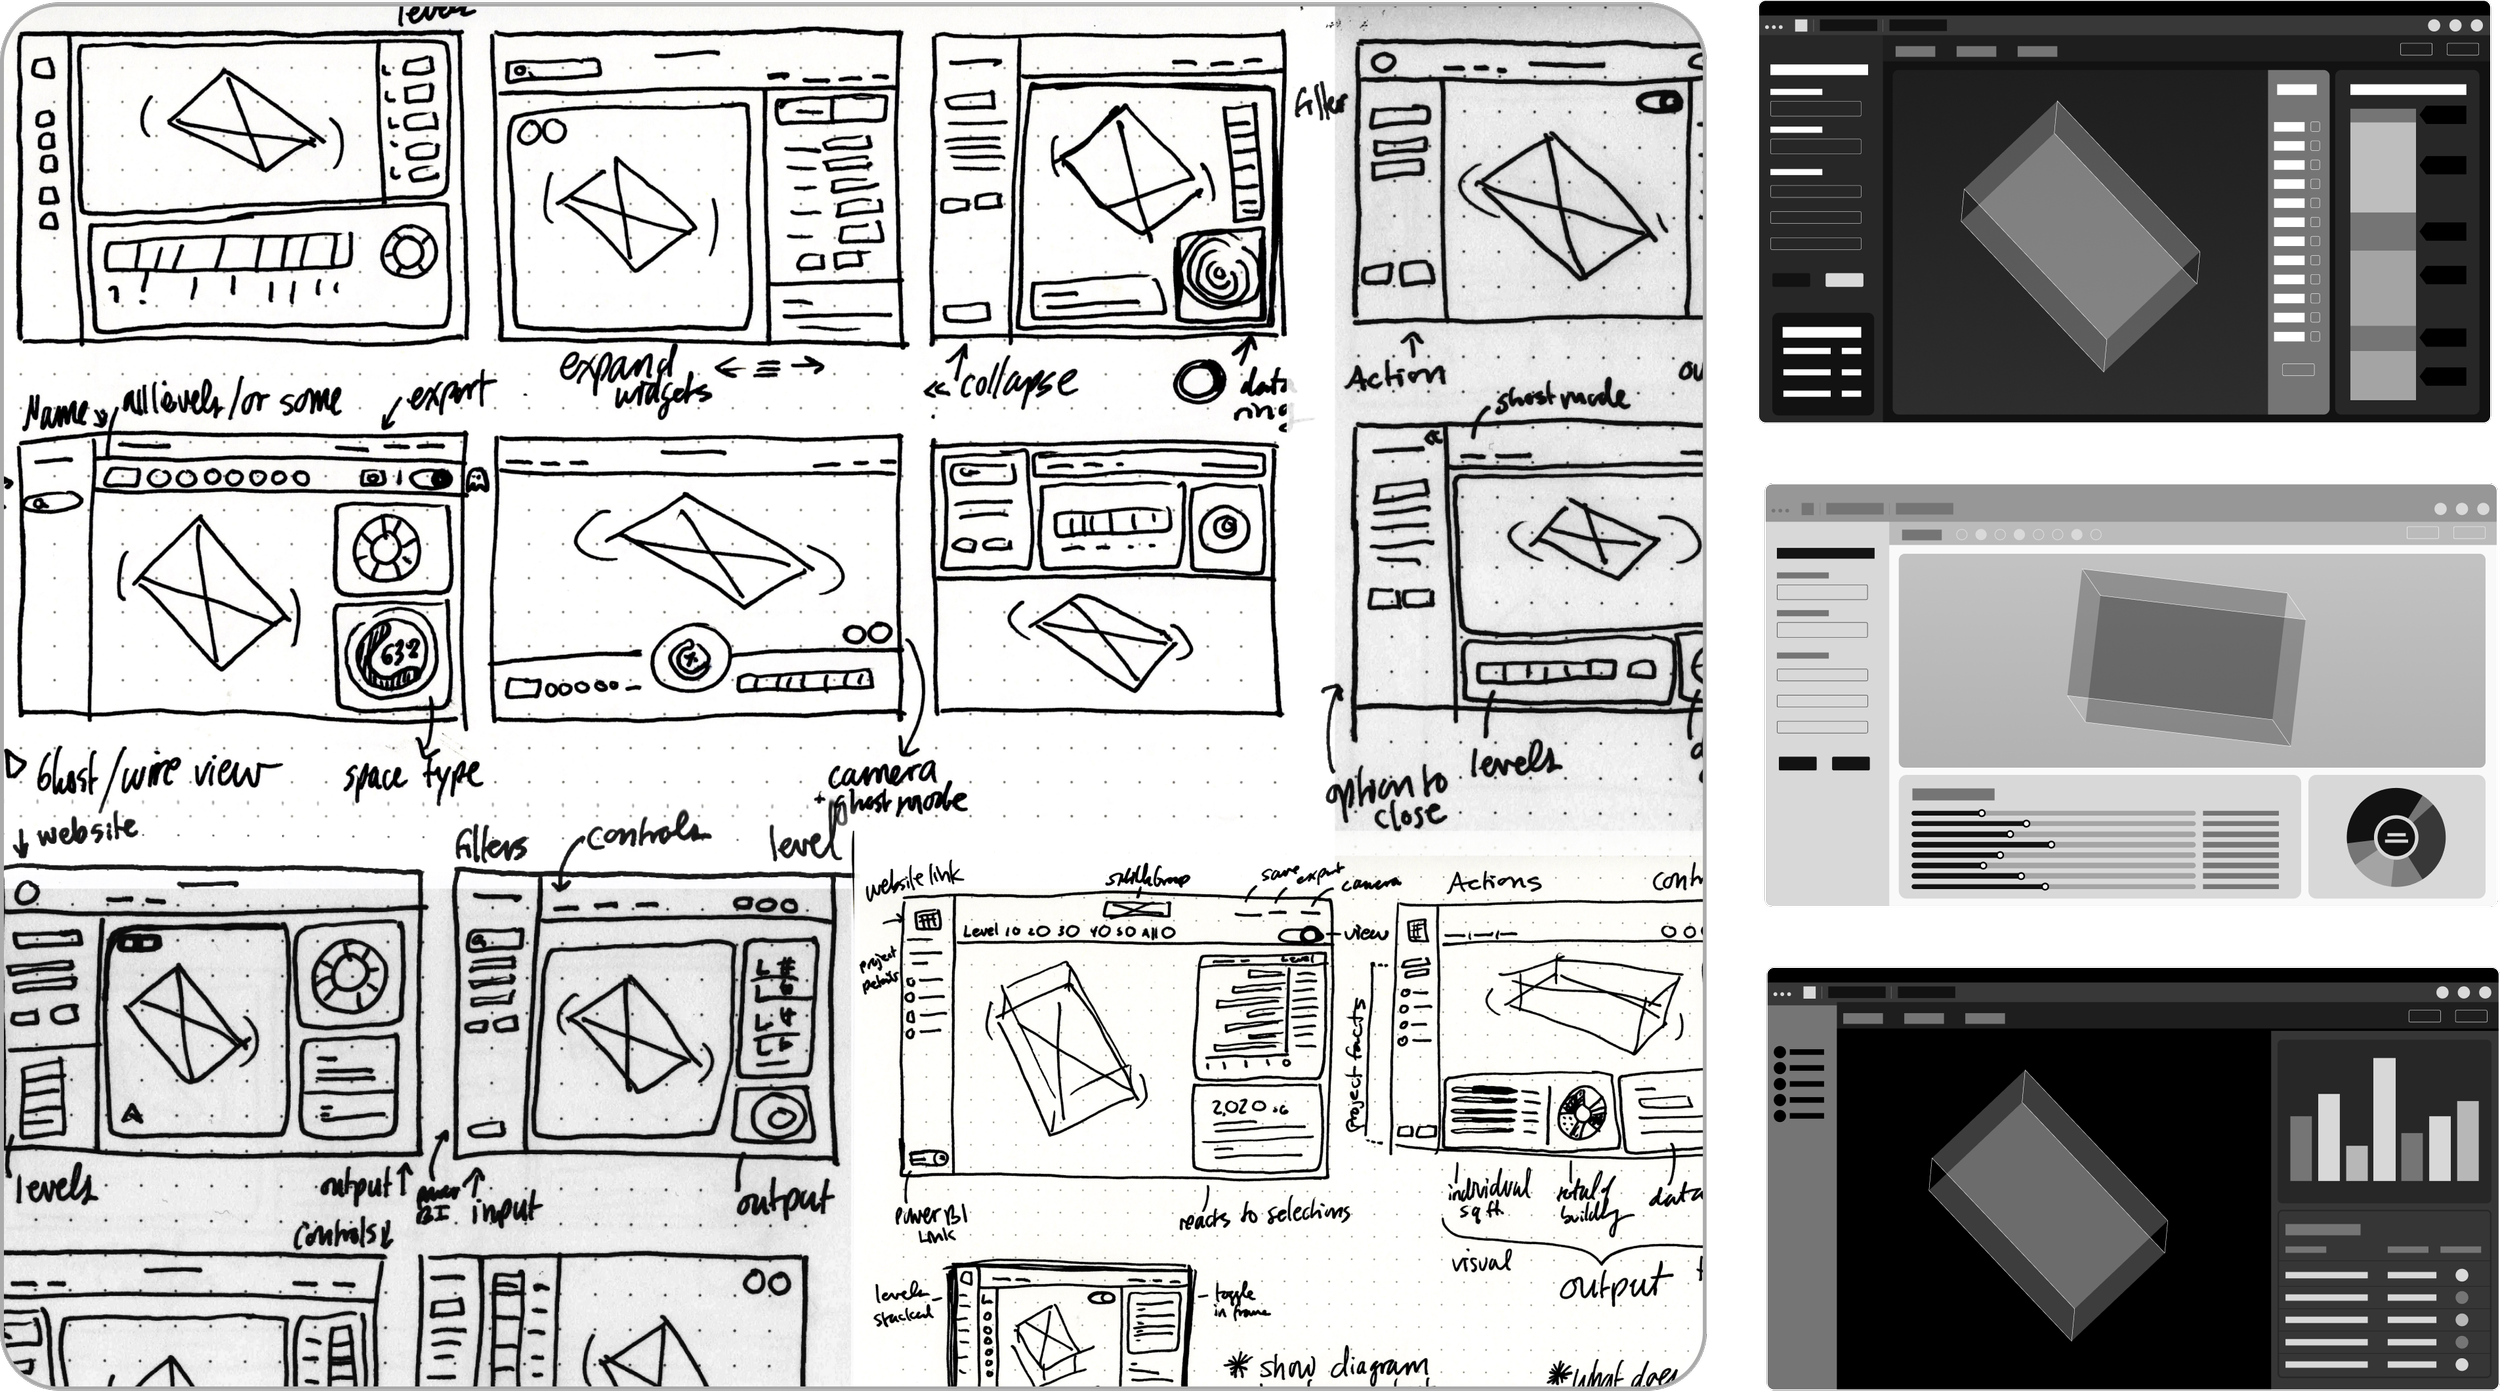
Wireframes
Rapid ideation focused on technical feasibility, streamlined data input, clear categorization, low cognitive load, and intuitive visuals.
Initial
Solution
I structured the interface around user actions, prioritizing intuitive data entry and aligning with the three insights driving design: centralized workflow, enhanced visualization, and efficiency.


User Testing
Collaborated on eight moderated usability tests using a Figma prototype I created to validate design decisions before development.
01 Design Update

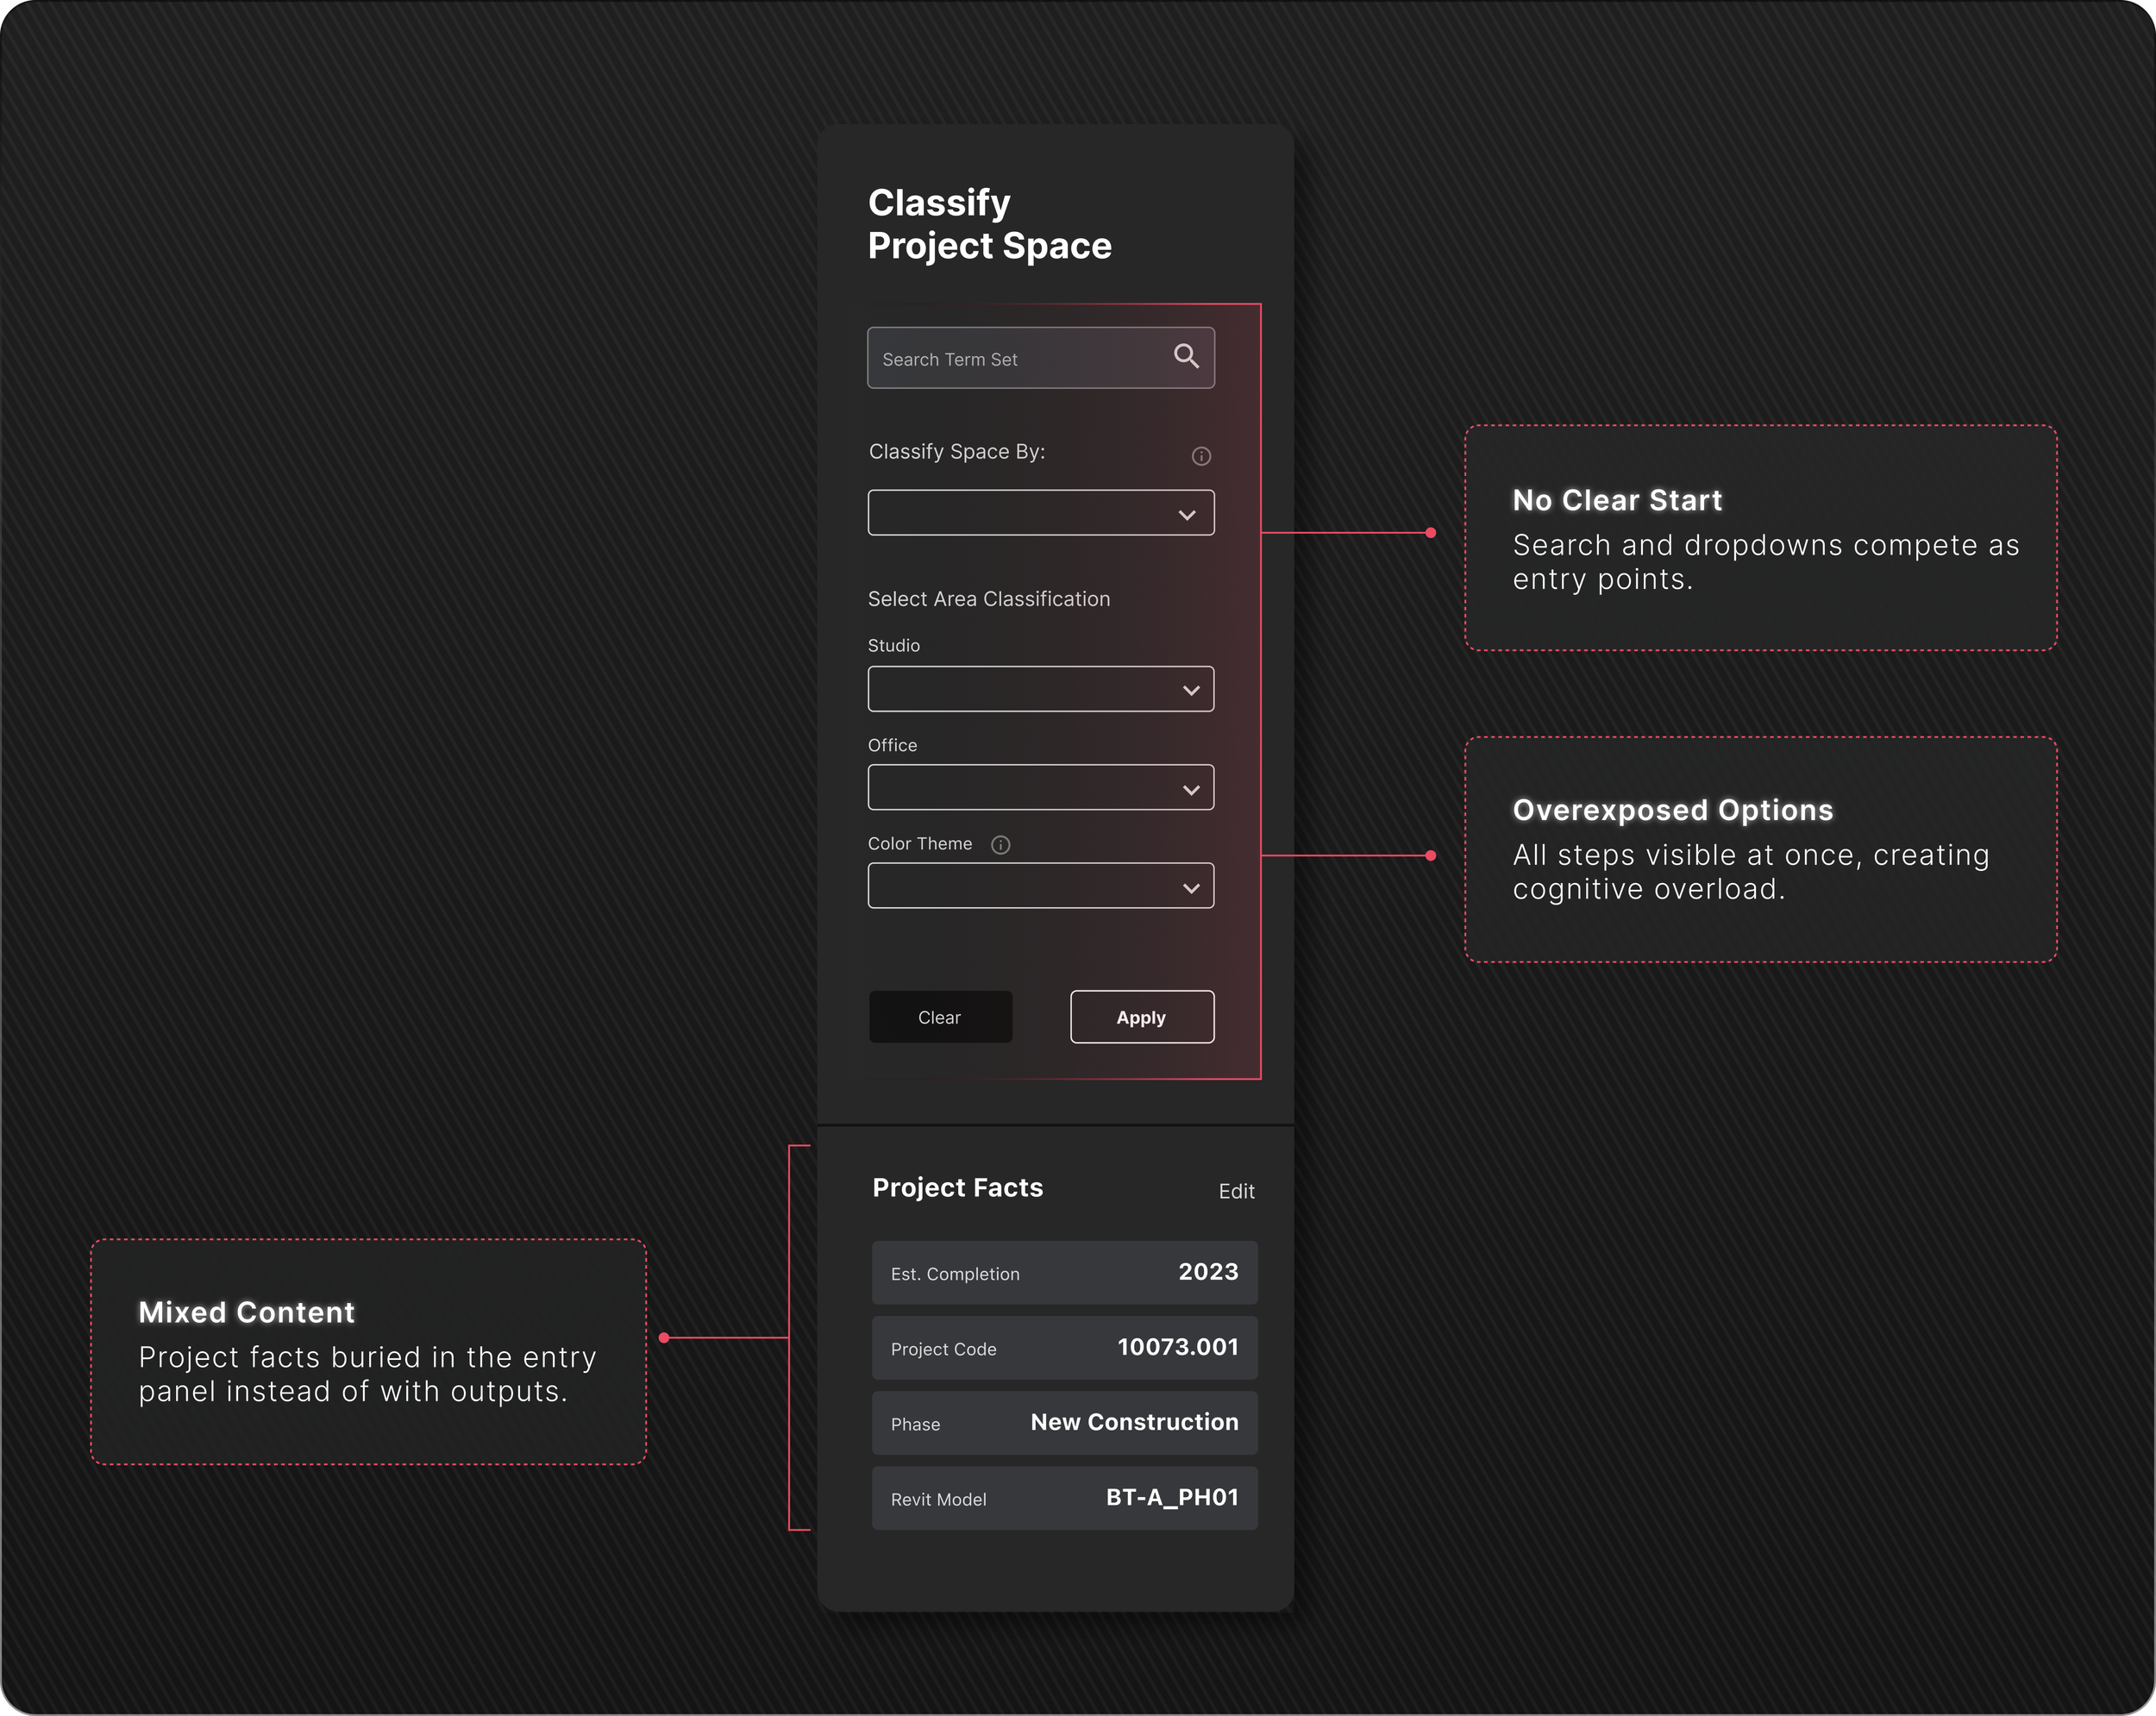
Before –
Unclear Flow, Mixed Purpose
Disorganized panel left users uncertain about steps and mixed input with output.
After –
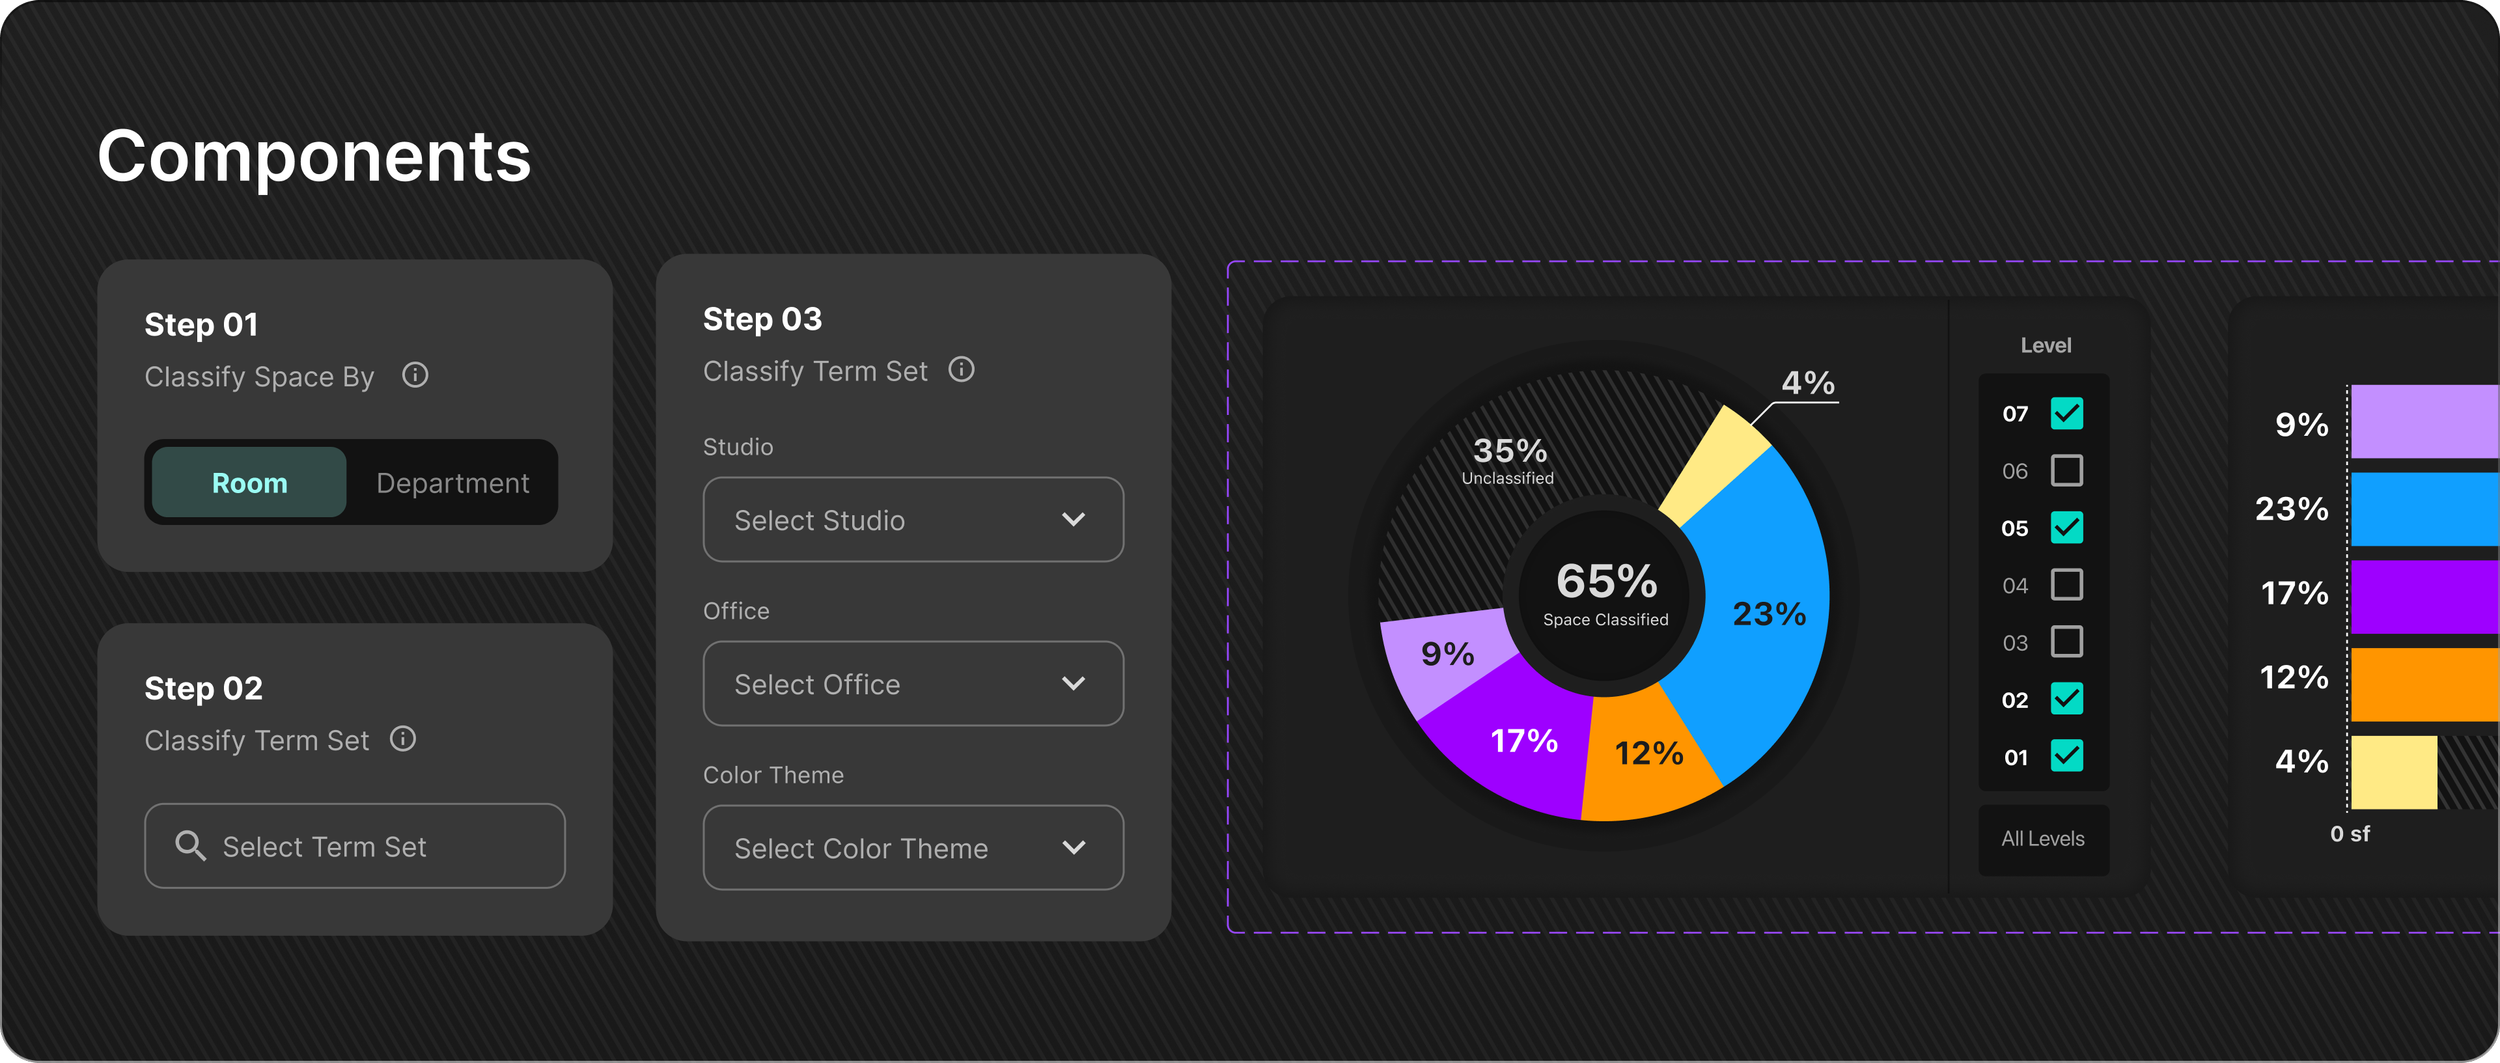
Guided Steps, Cleaner Panel
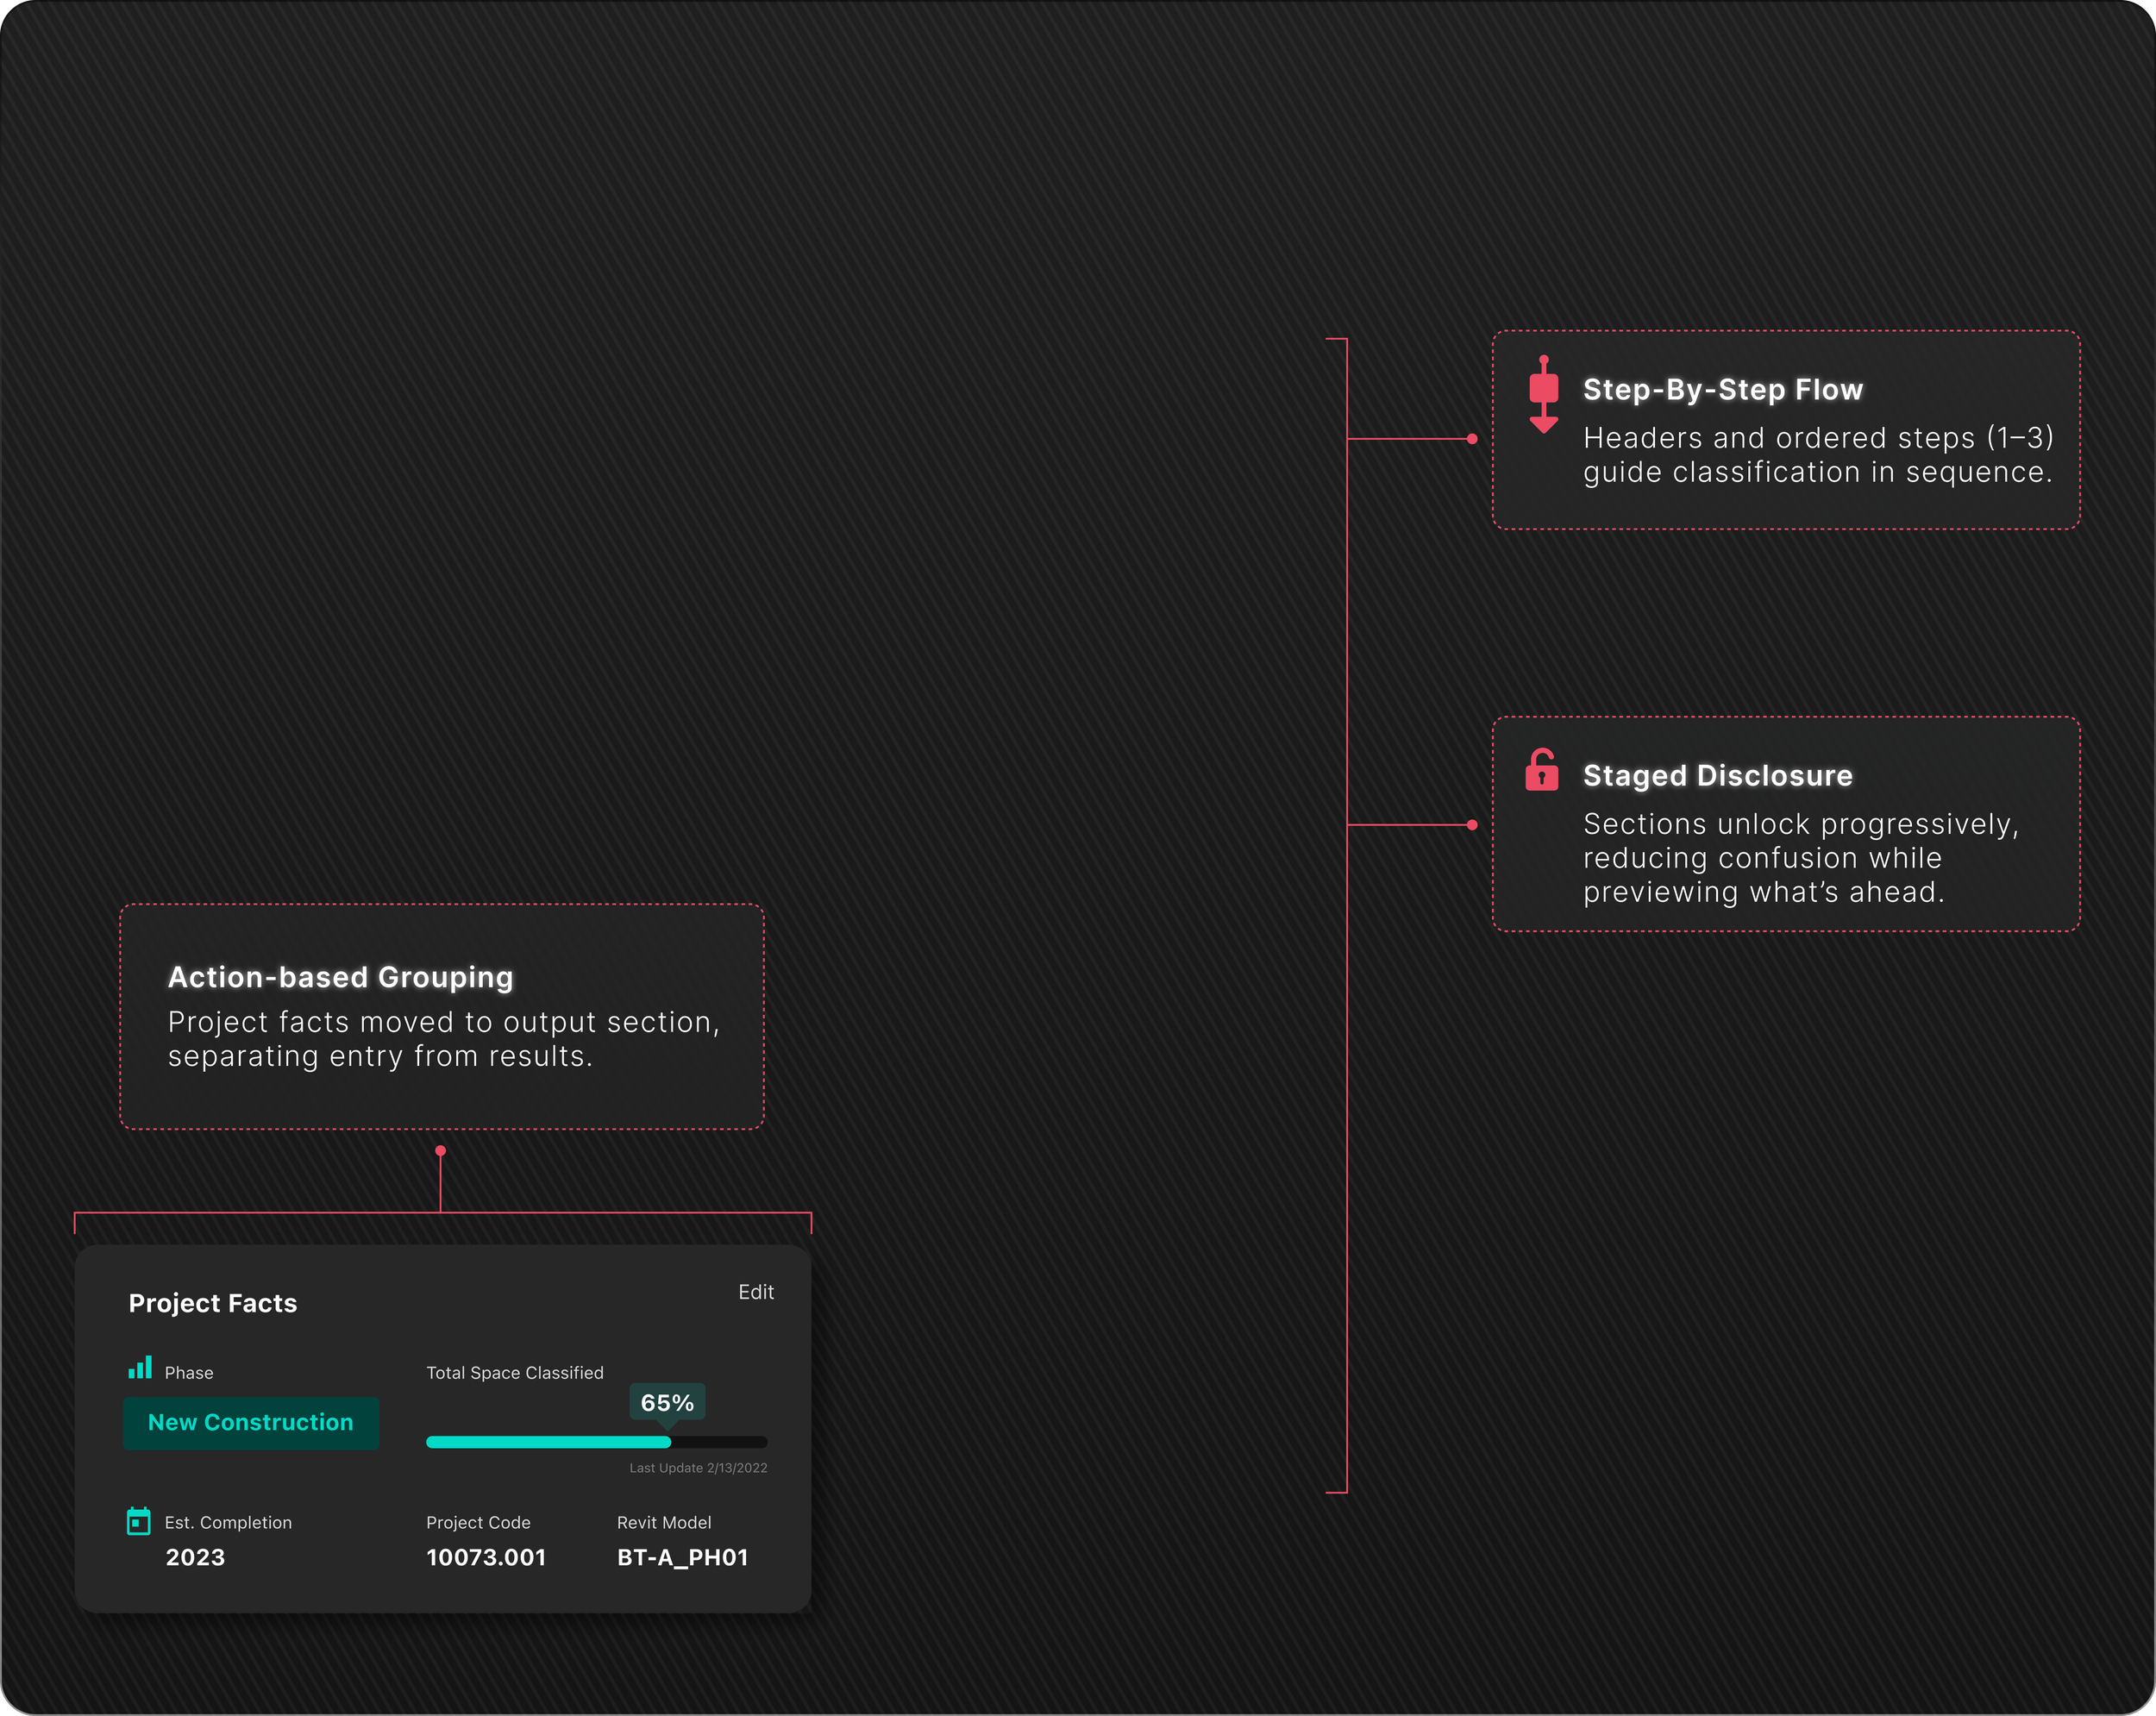
Structured data entry flow with staged disclosure and clear grouping for better task clarity.
02 Design Update

Before –
Unclear Control Context
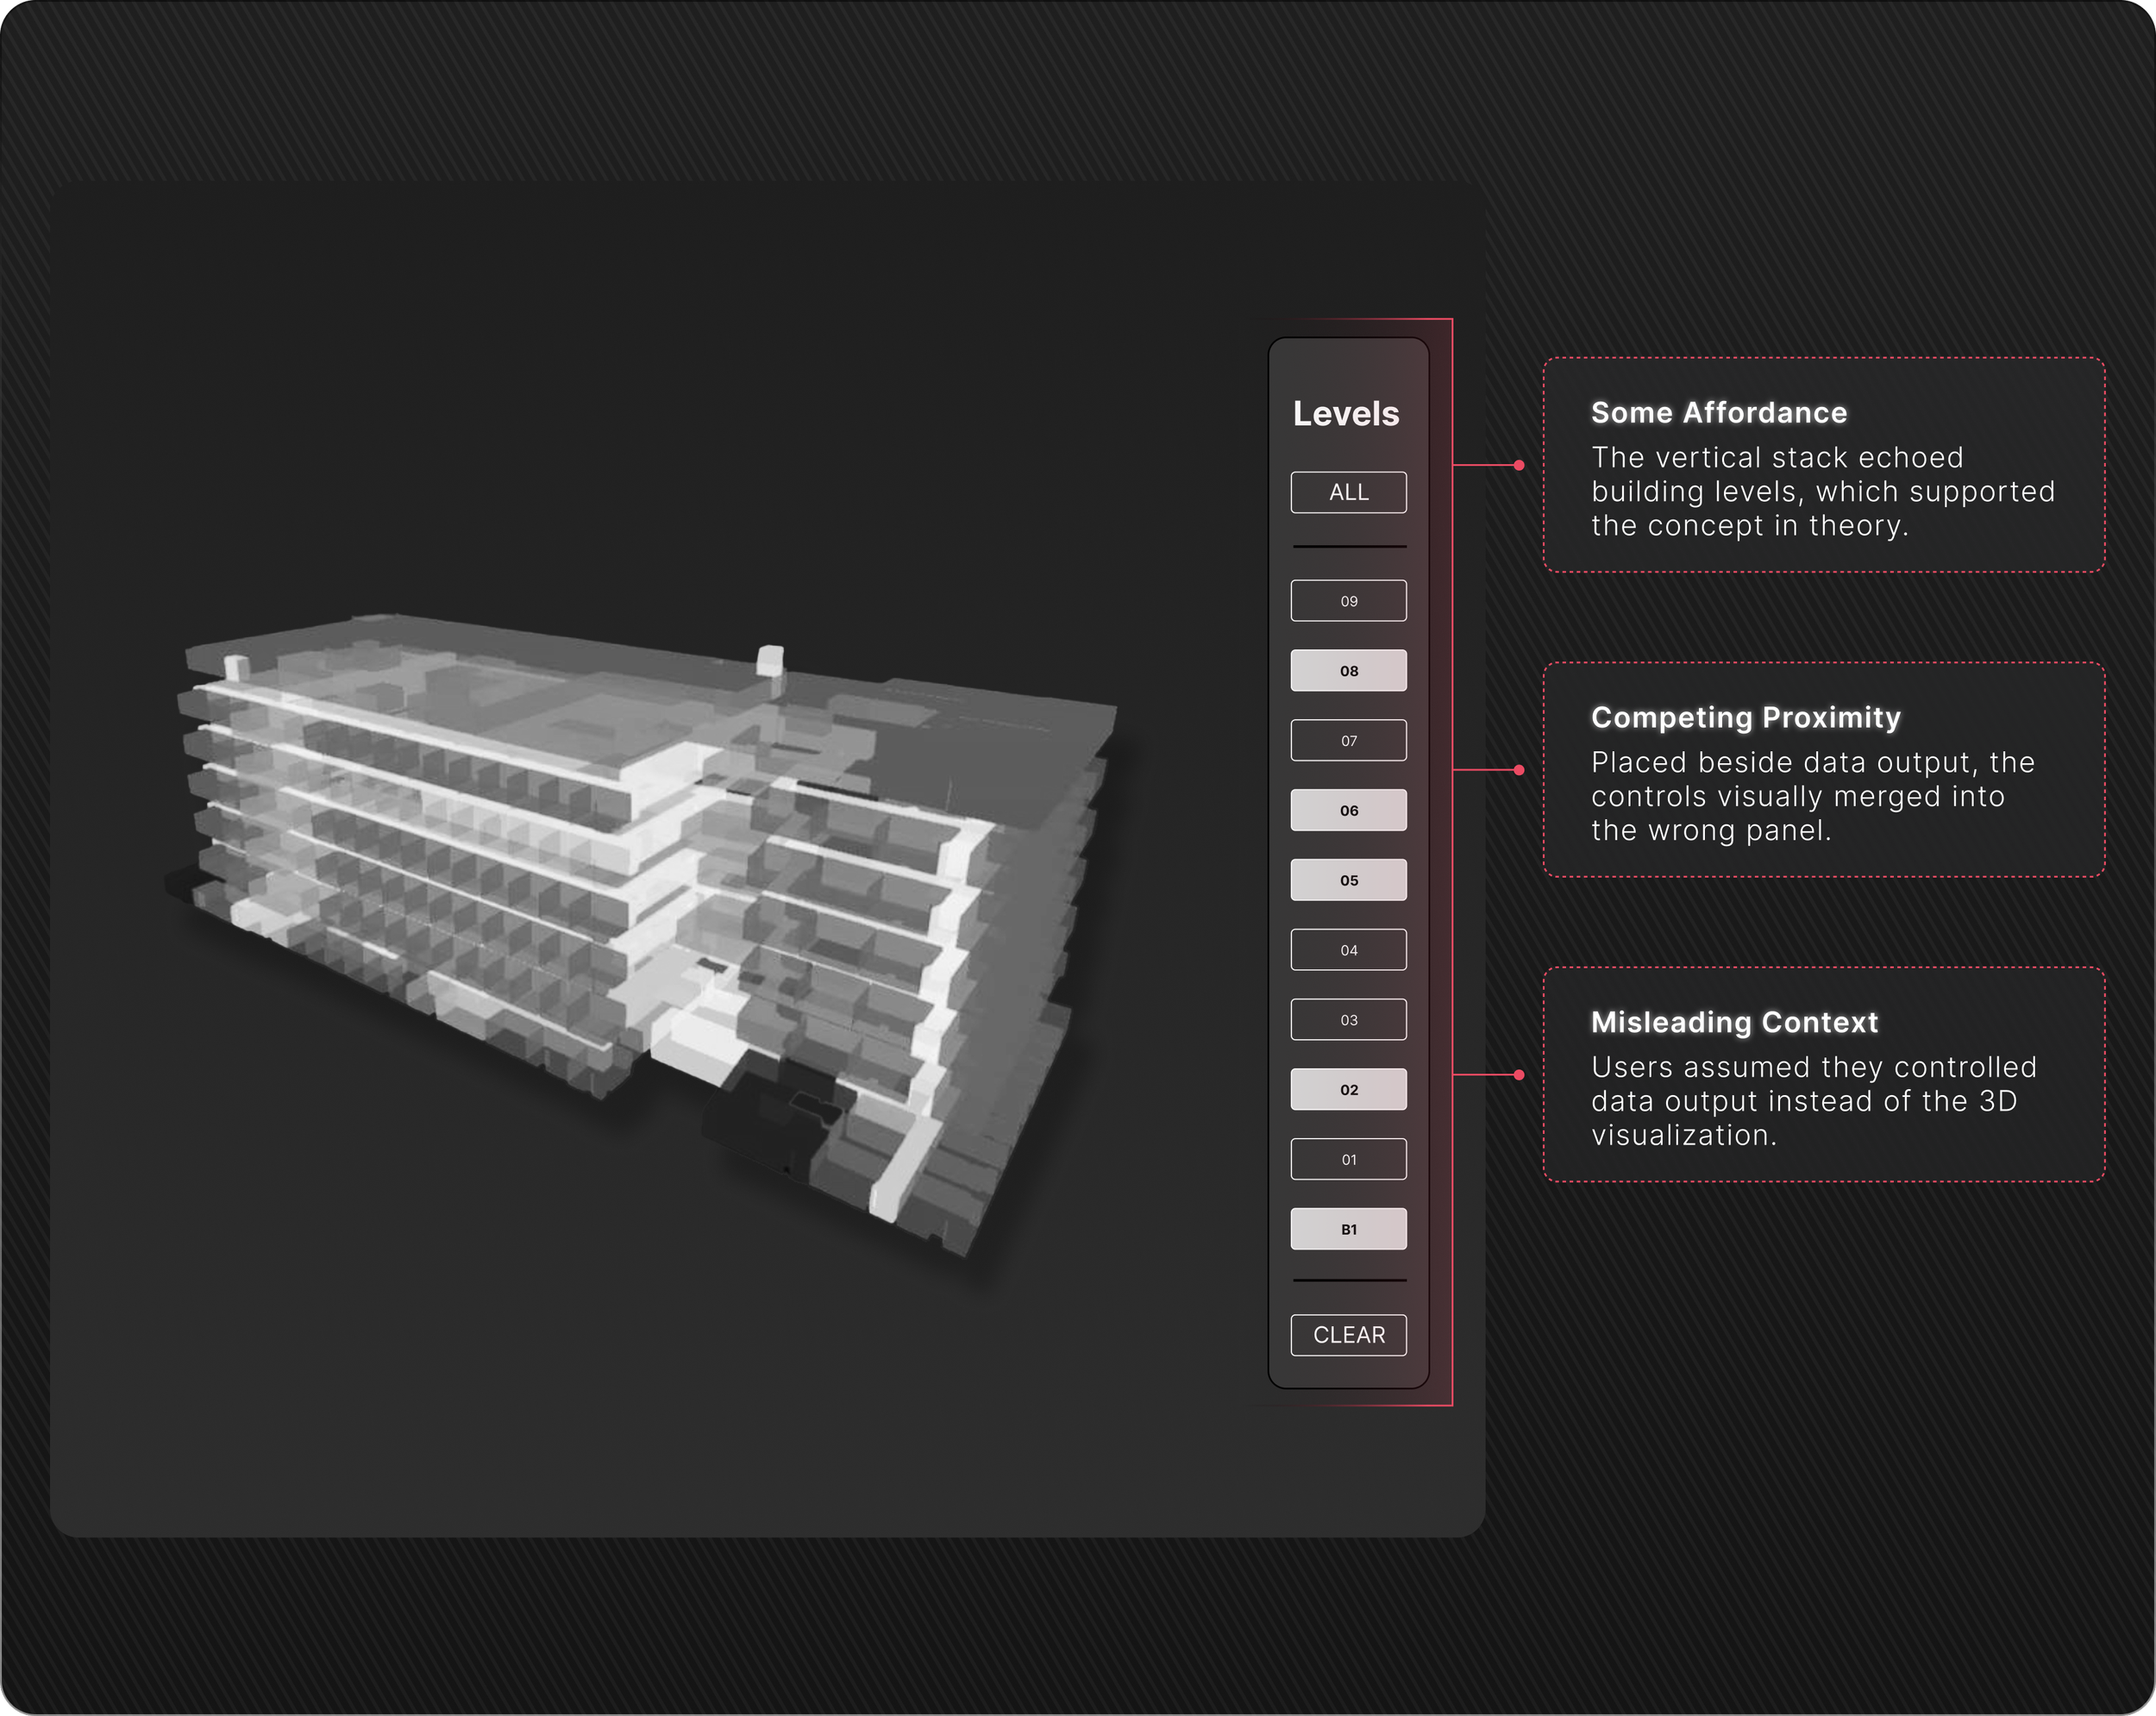
Vertical controls blended into the output panel, creating confusion despite a logical design choice.
After –
Clear 3D Controls
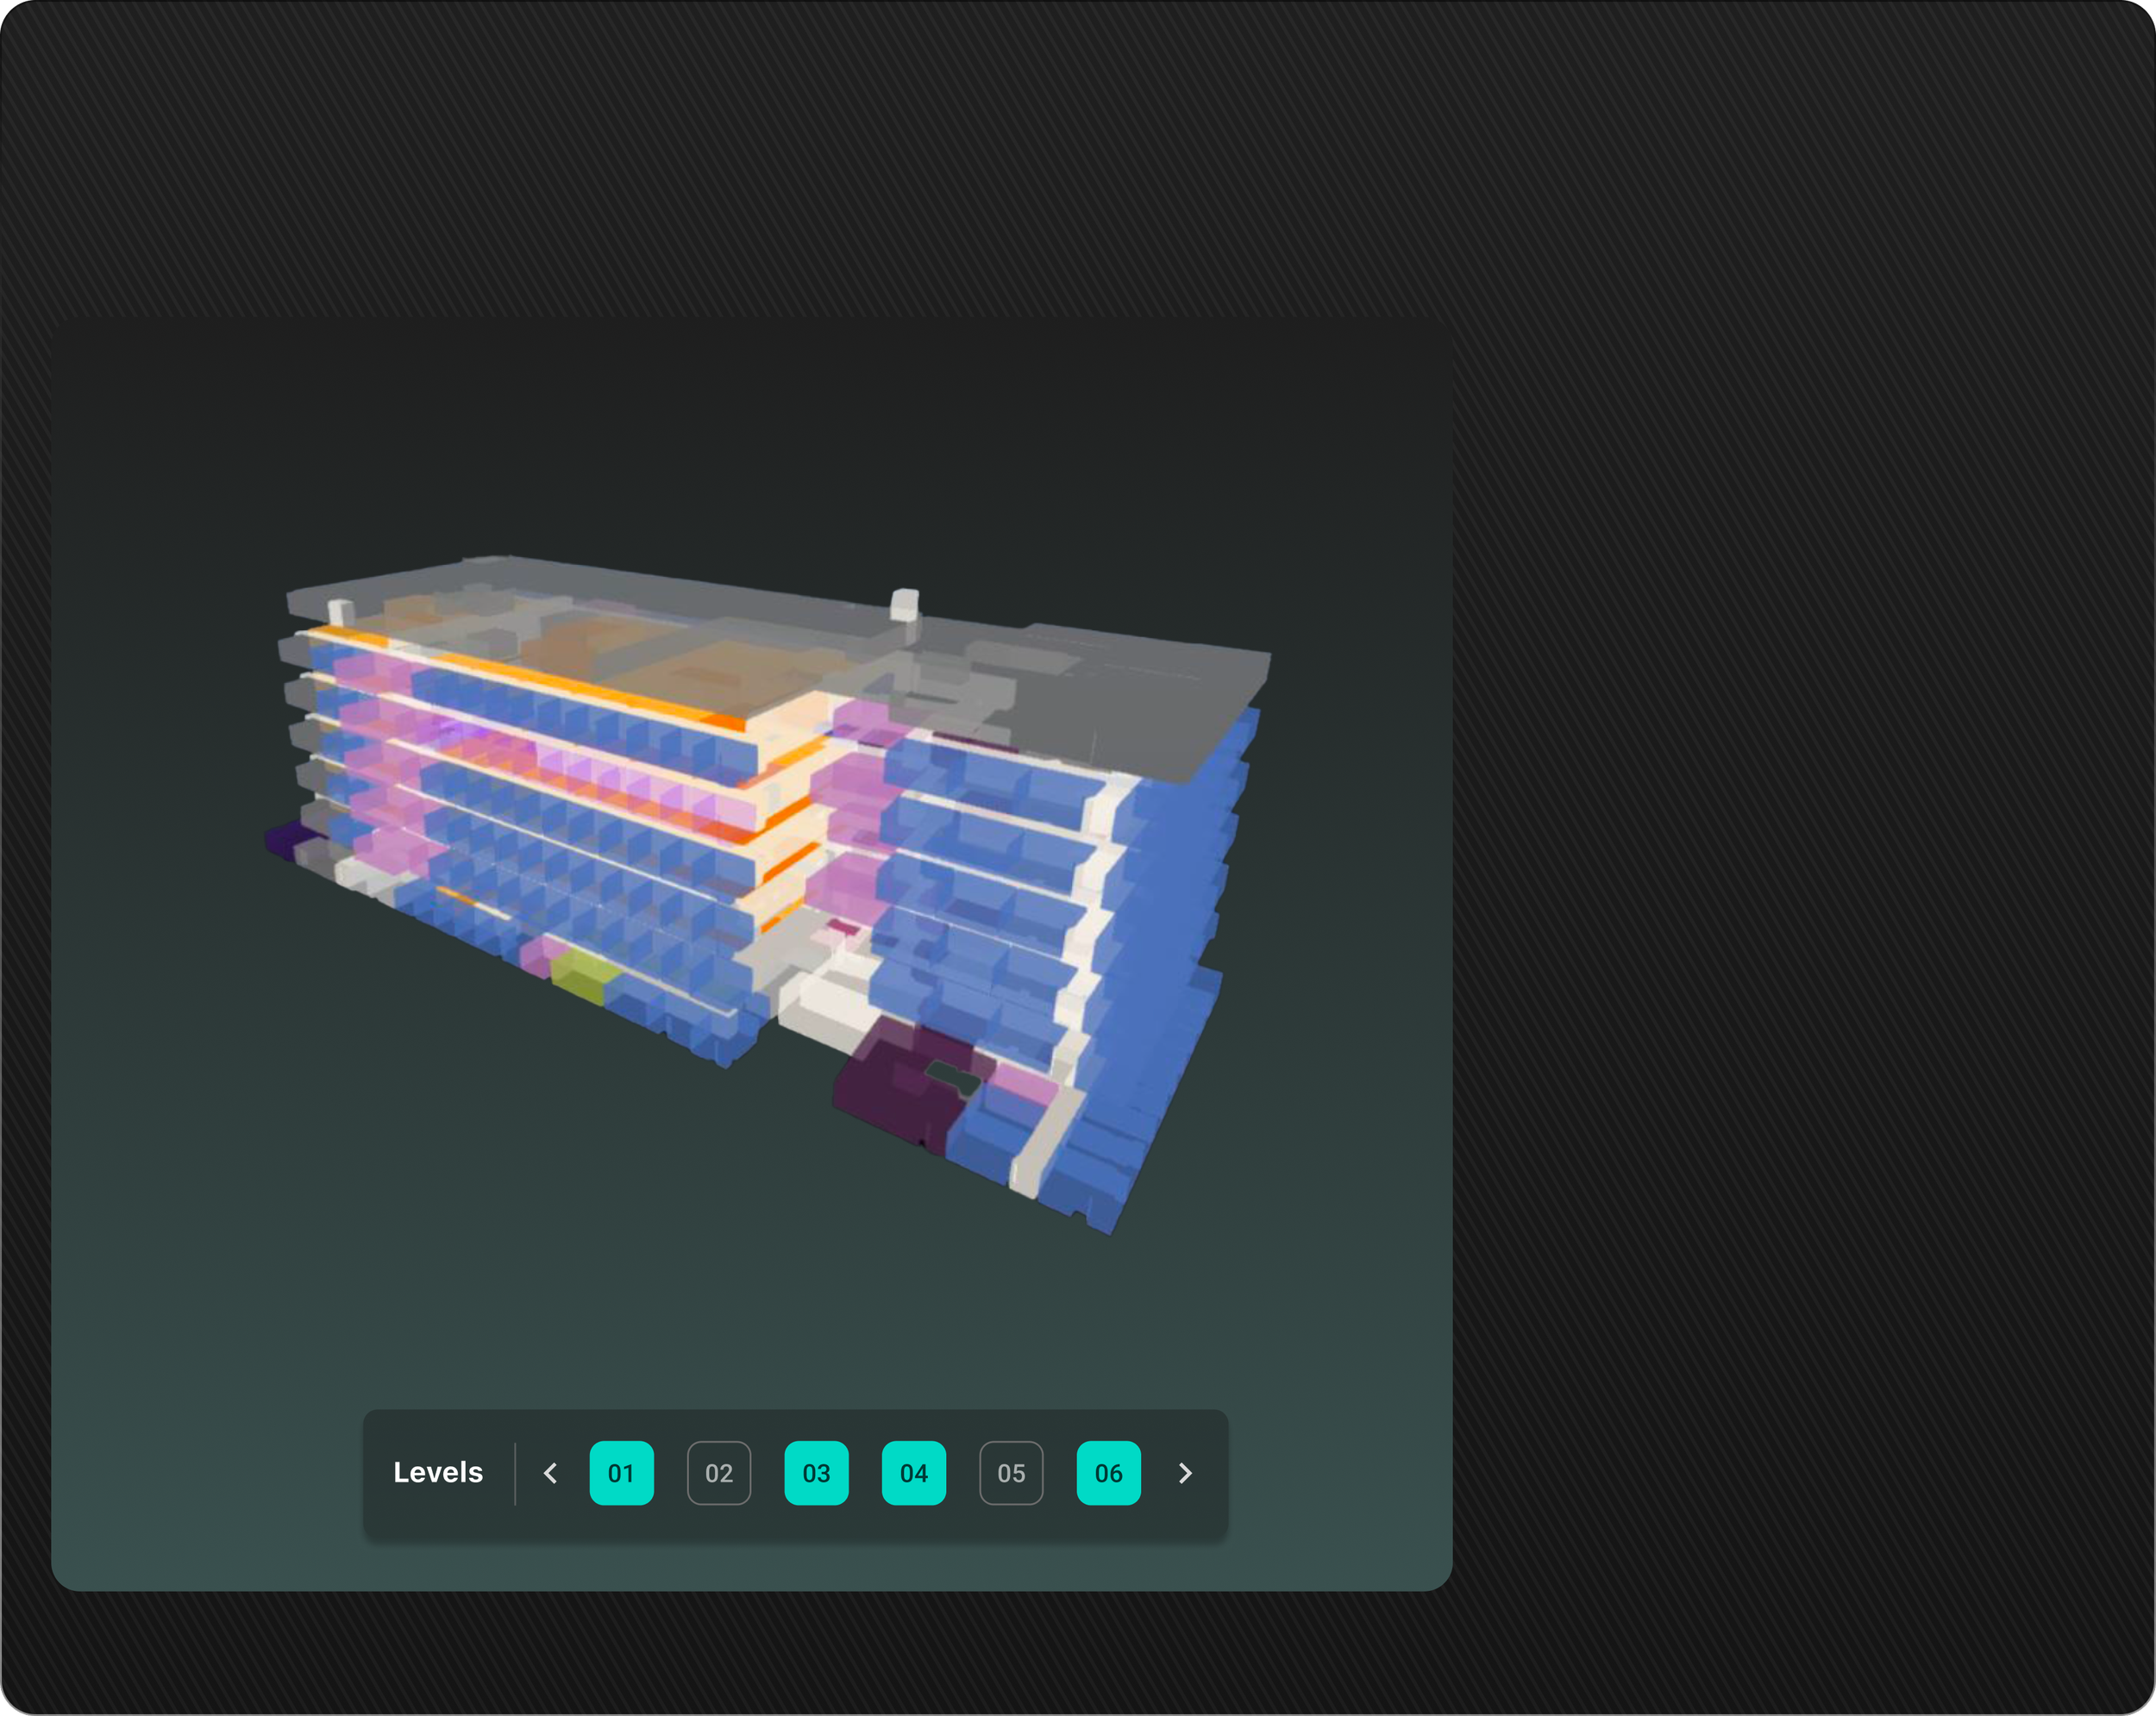
Horizontal level selector placed at bottom of interactive panel for clarity and focus.
03 Design Update
Before –
One View,
Low Clarity
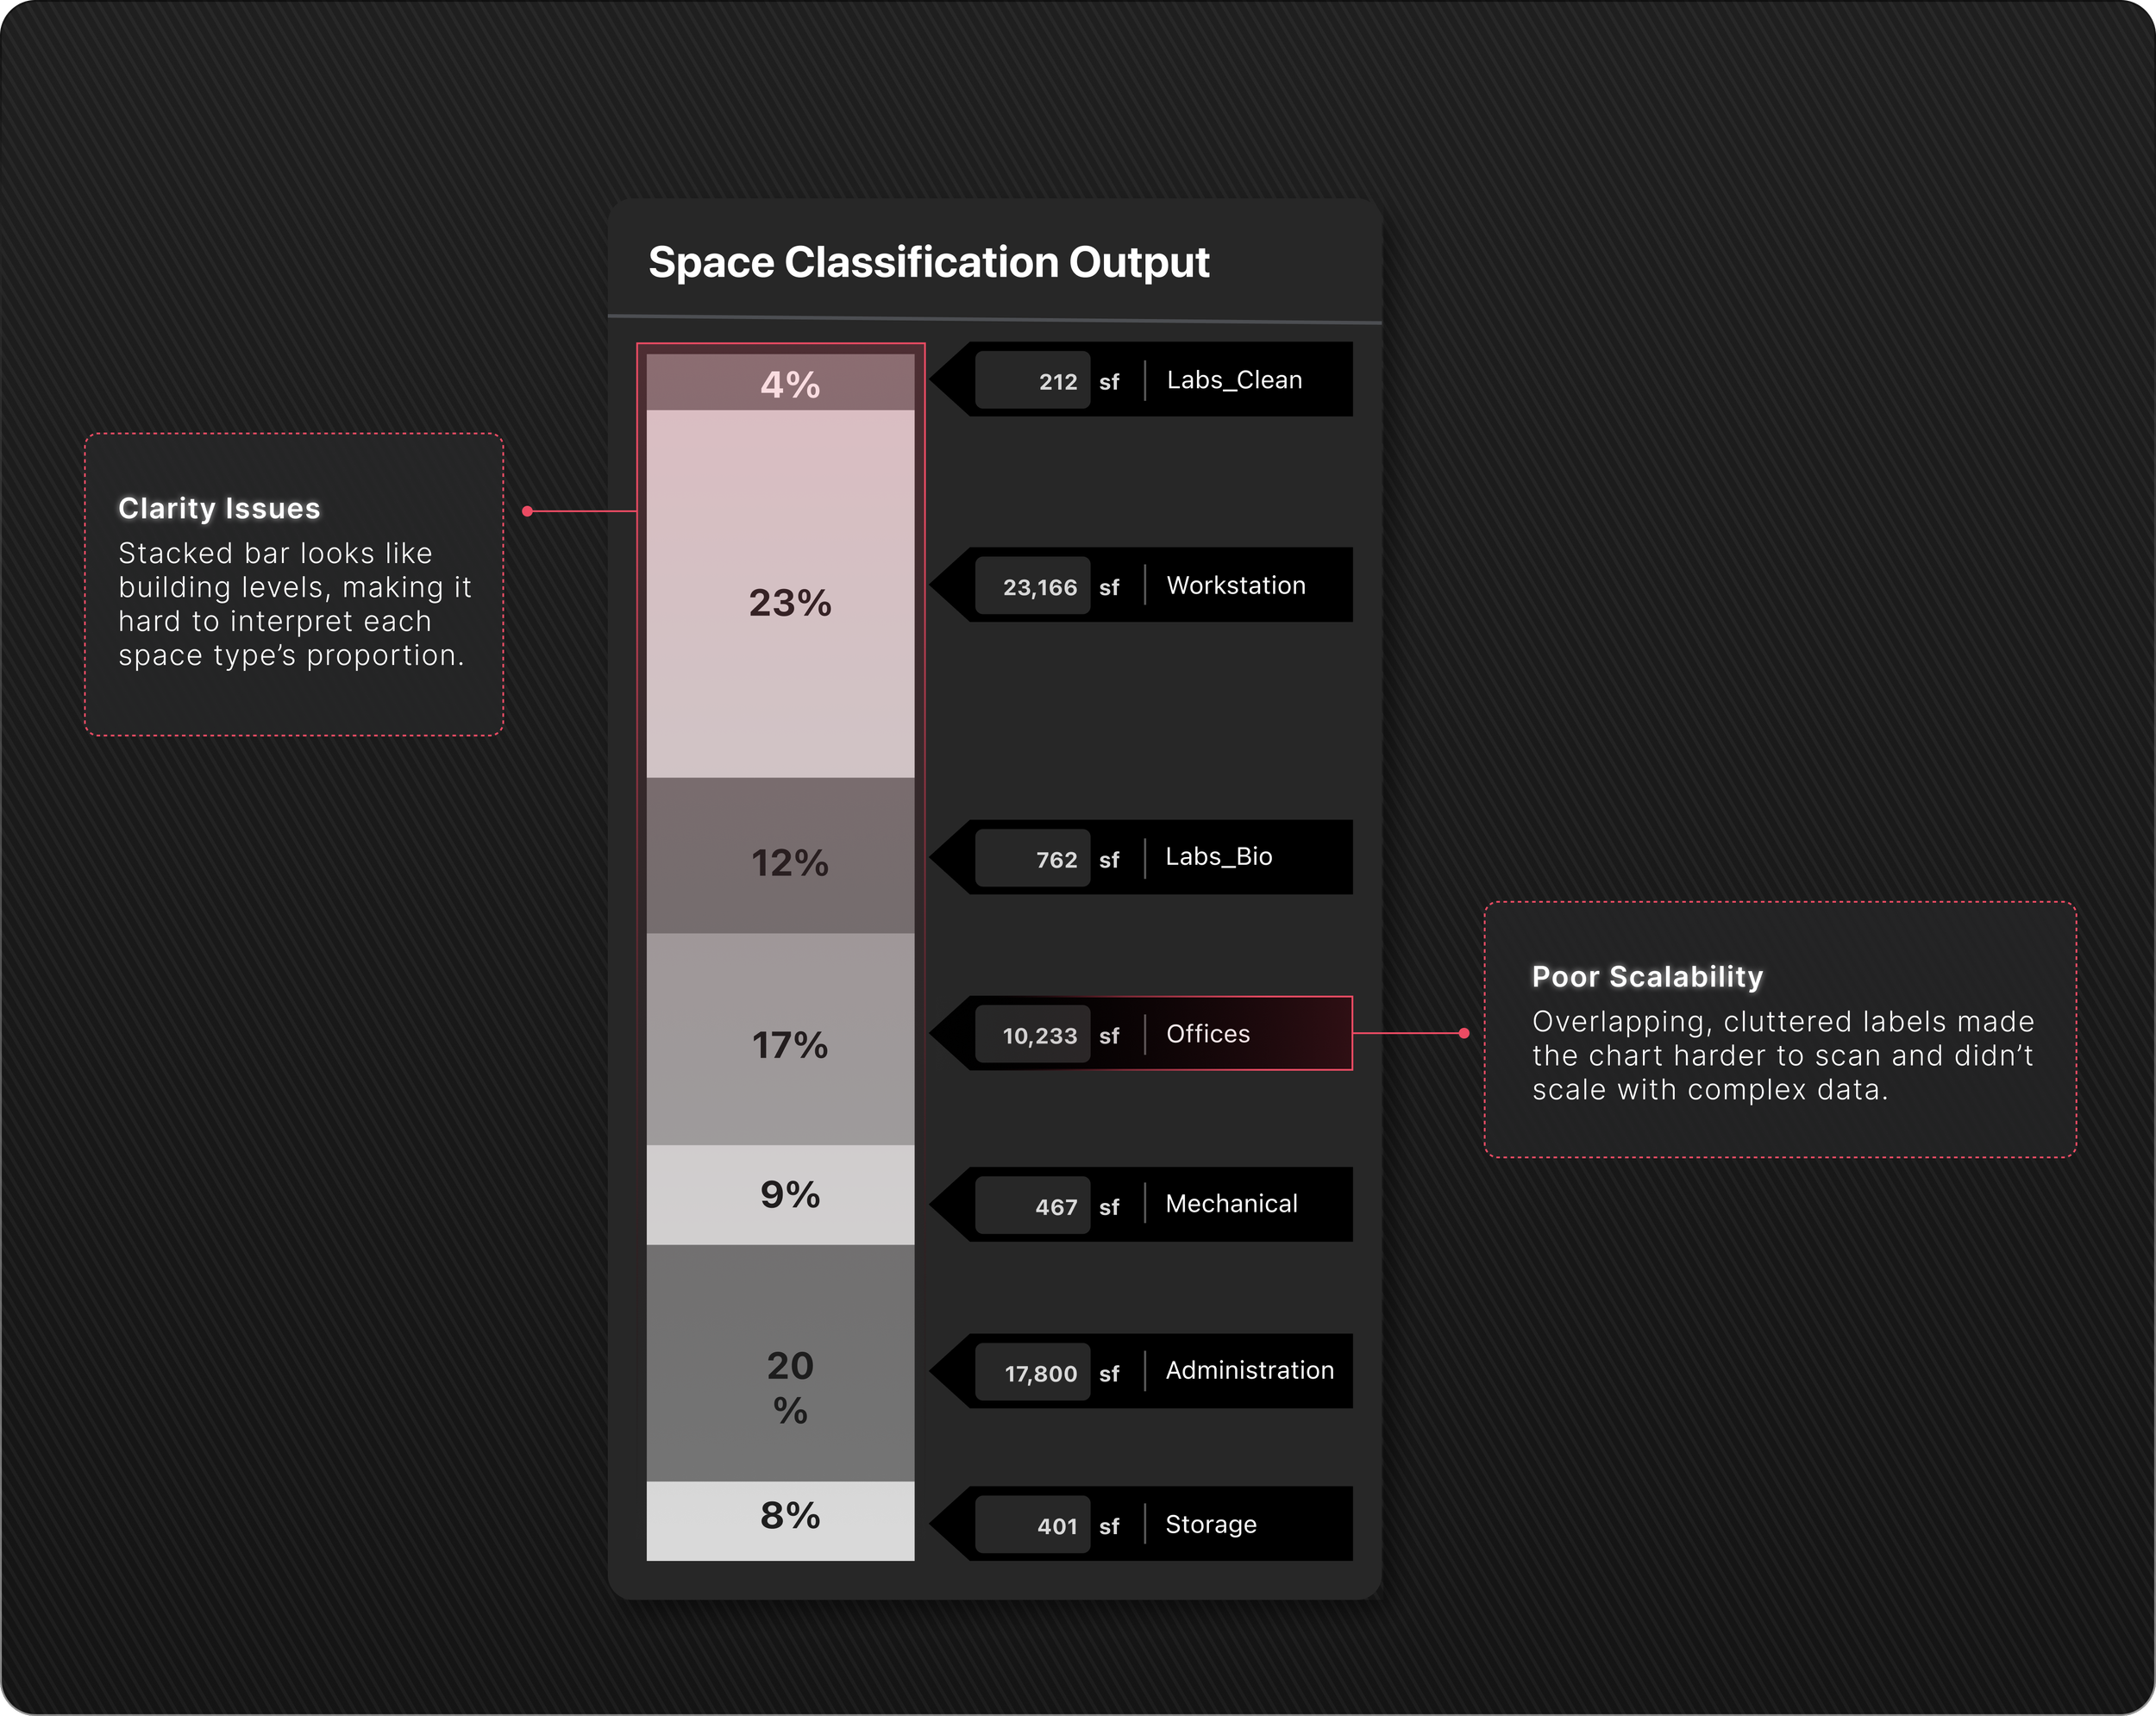
Stacked bar with crowded labels, limited readability, no flexibility.
After –
Flexible Views, Finer Control
Toggle between a circle graph for building totals and bars for easy space-type comparisons.


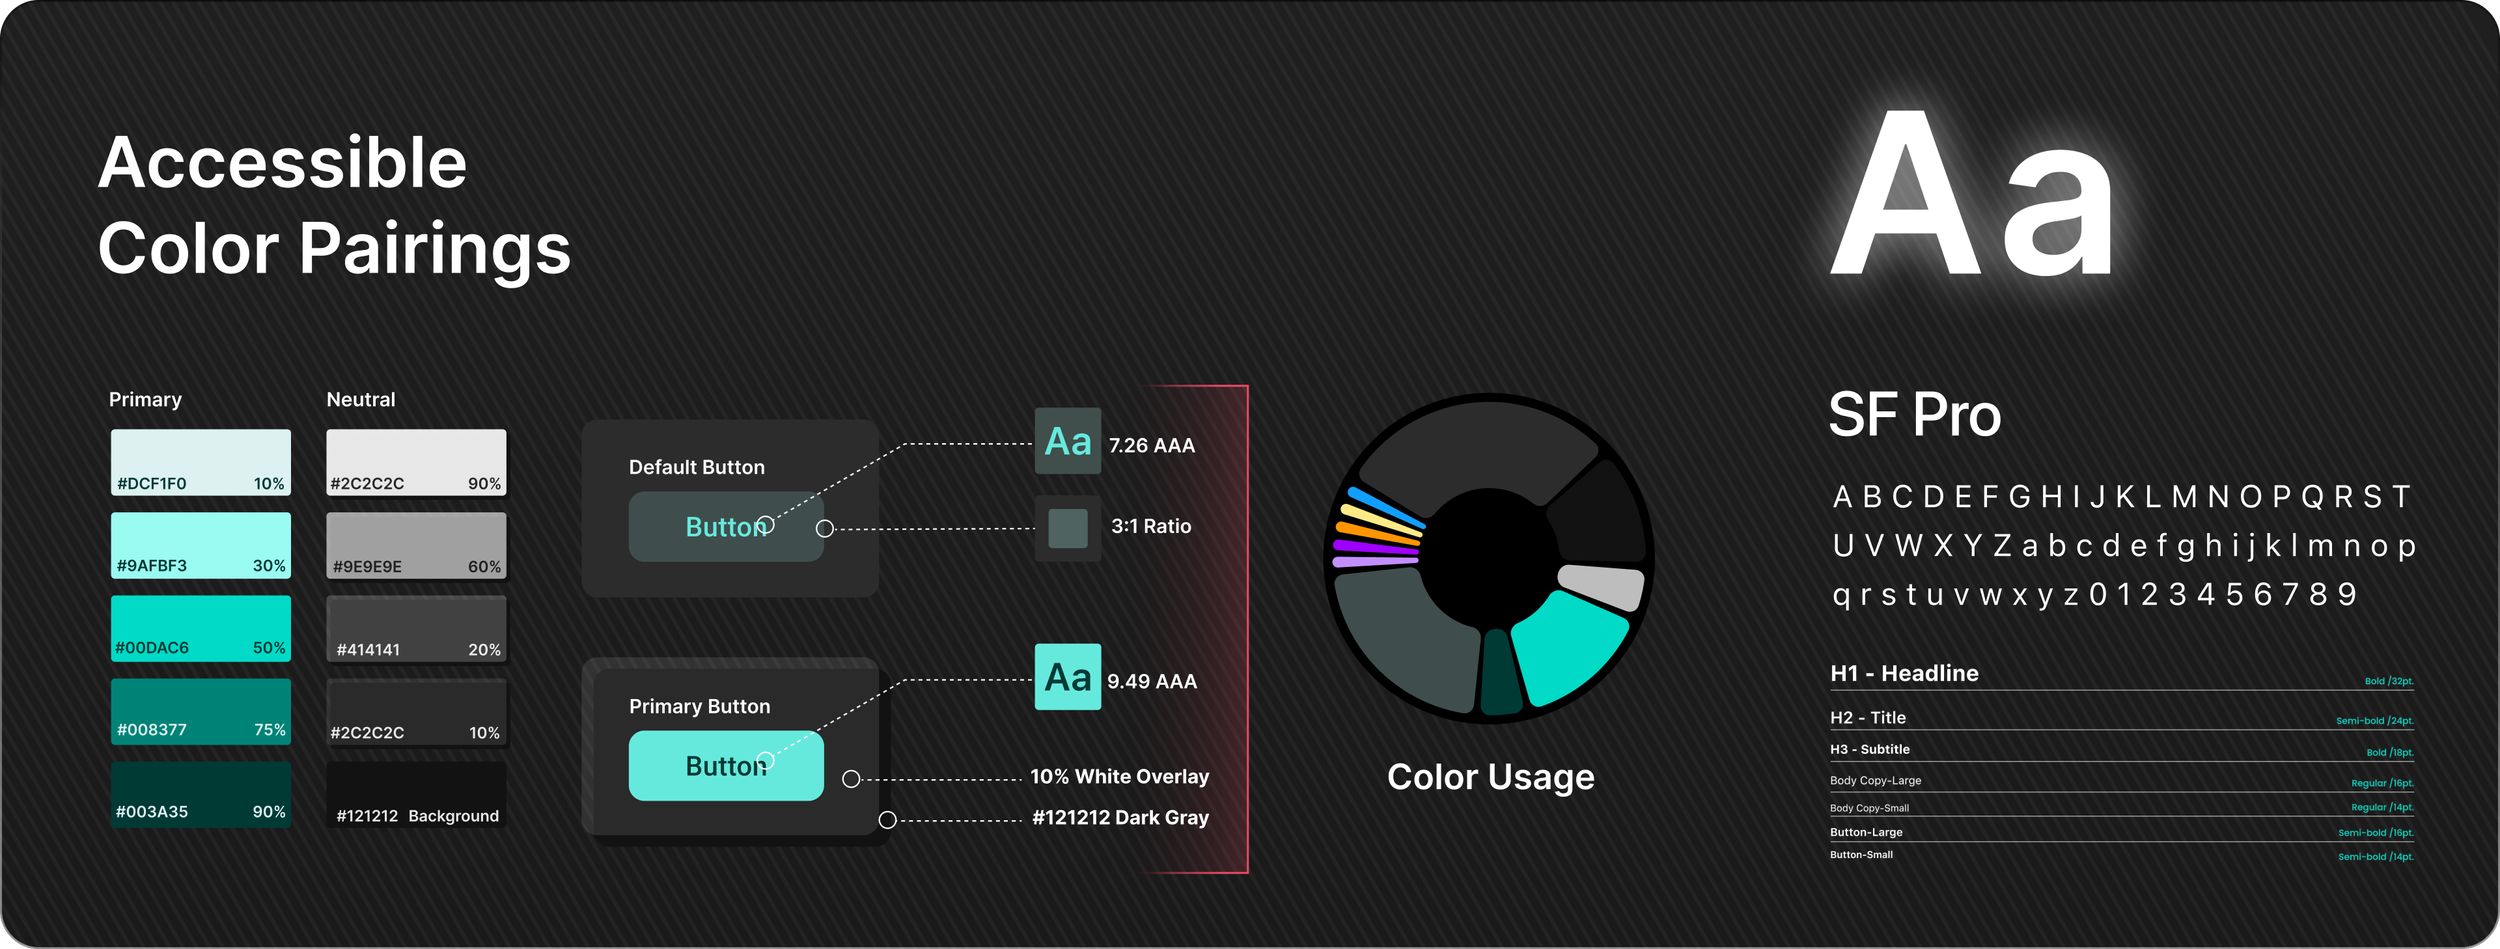
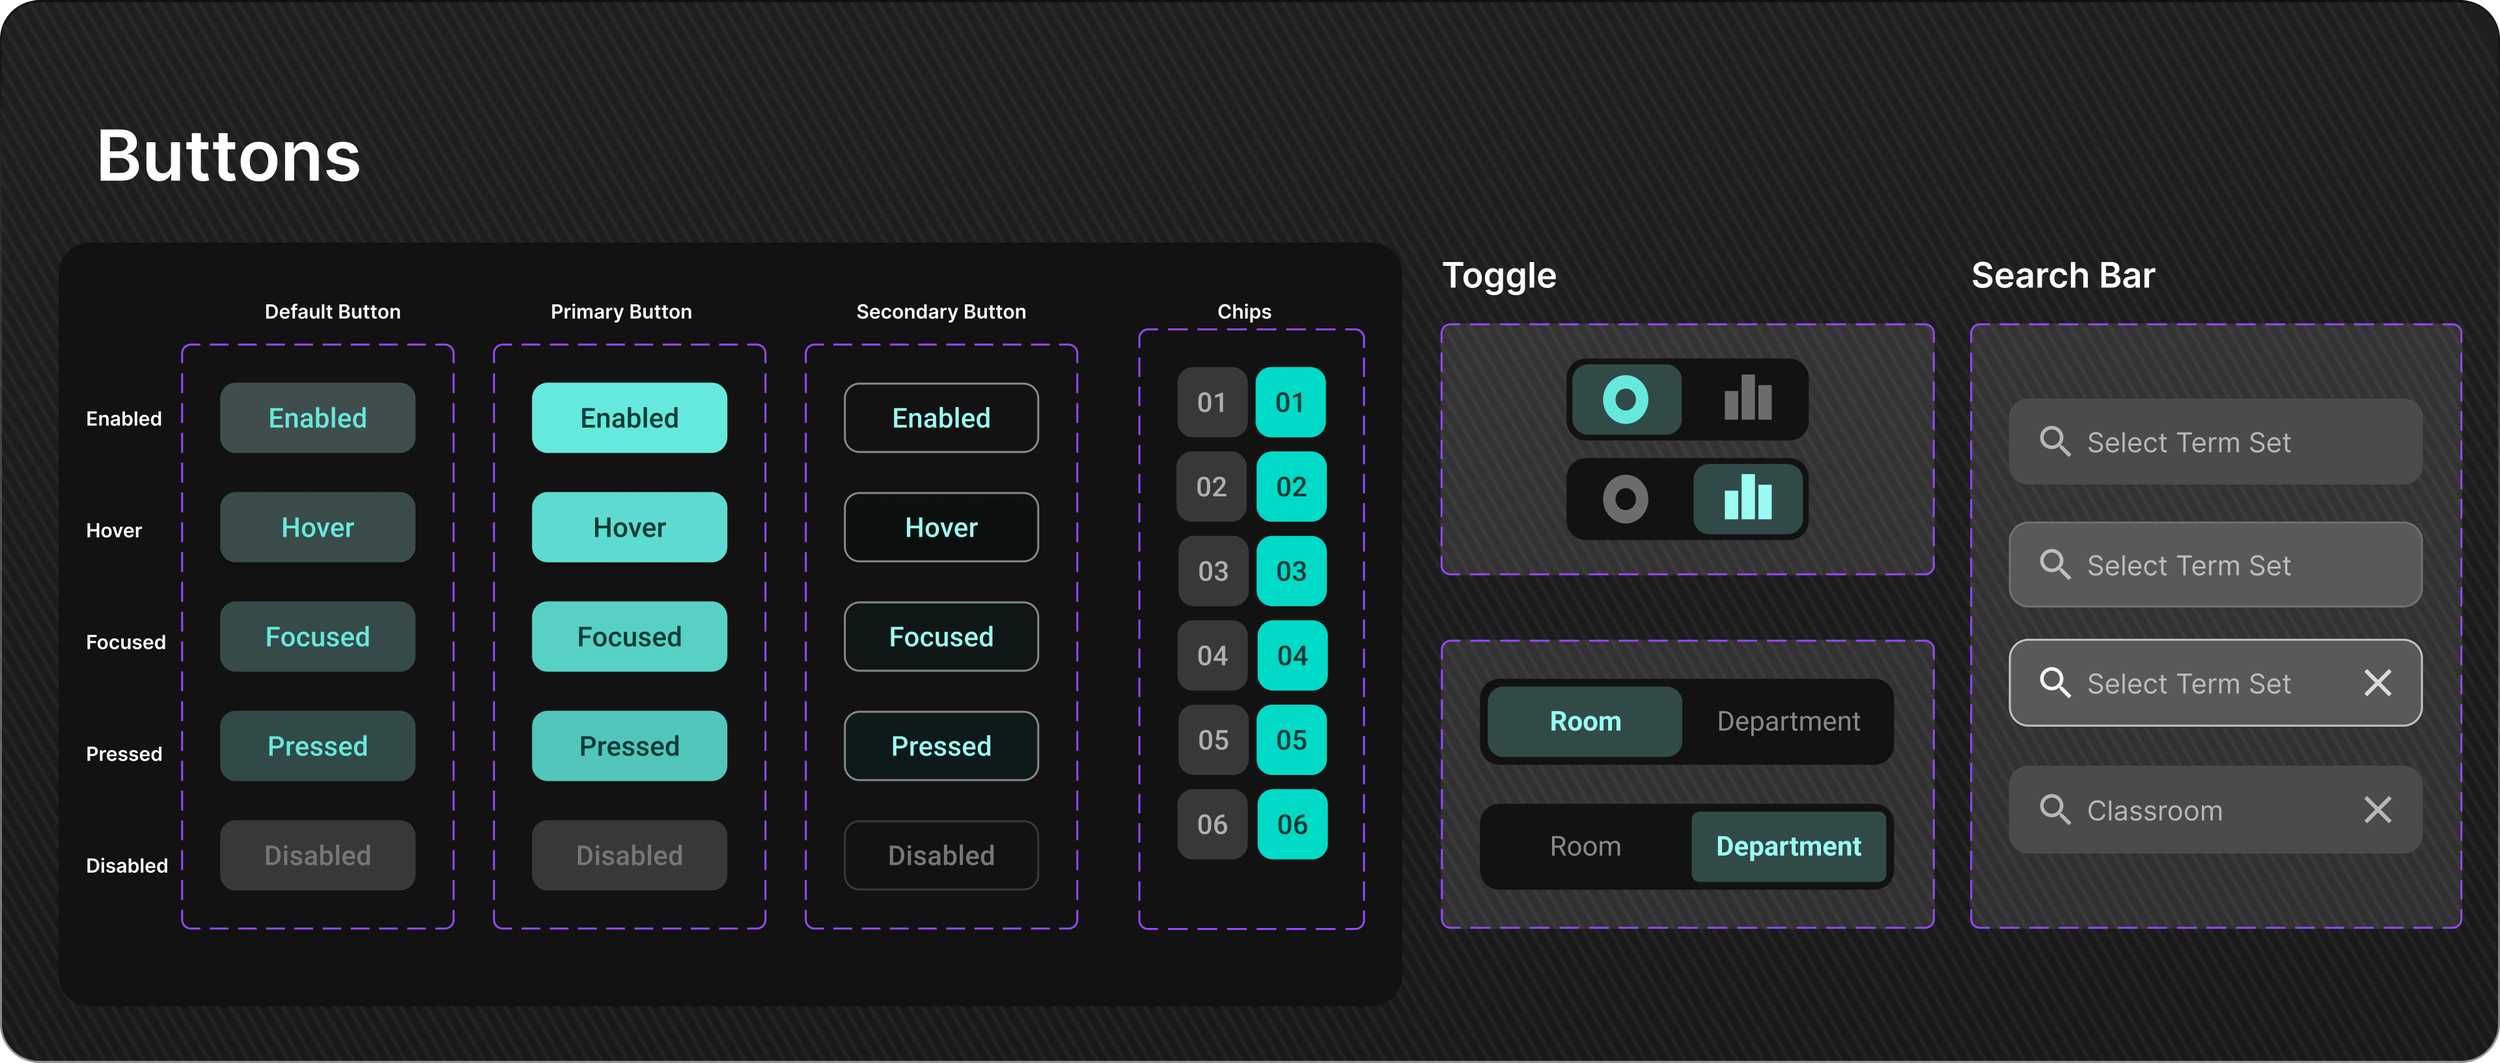
Scalable Design System

Evaluating Impact
423 projects classified totaling 40,000,000+ sqft classified to date
by over 400+ users
by six in-house studios.
Lessons Learned
Validate
Assumptions With Testing
Testing prototypes in users’ actual workflow uncovers true priorities and guides iterative refinement.
Design for Scalability
Building modular systems that apply to the full interface and extend across other platforms like Power BI dashboards.
Integrate Early with Technical Teams
Collaborating with engineer team early & often prevents misalignment and reveals opportunities for automation.

Next Steps
Enhance Onboarding Experience
Design a smoother entry point for new users and those returning after a break.
Consider interactive tutorials, contextual tips, or guided workflows to help users get oriented quickly.
History & Revision Tracking
Introduce a history area where users can view changes they’ve made.
Enable easy rollback or edits to correct mistakes and maintain confidence in data integrity.
Leverage AI for Data Entry Automation
Explore opportunities to automate repetitive data entry tasks.
Use AI suggestions or predictive inputs to speed workflows while keeping user control.

Explore Another Project
-
![Buddy–Helping youth in foster care know their rights.]()
Buddy | Mobile App Design
